Longyearbyen UHI experiment, 2 February 2007
Open Climate4you homepage
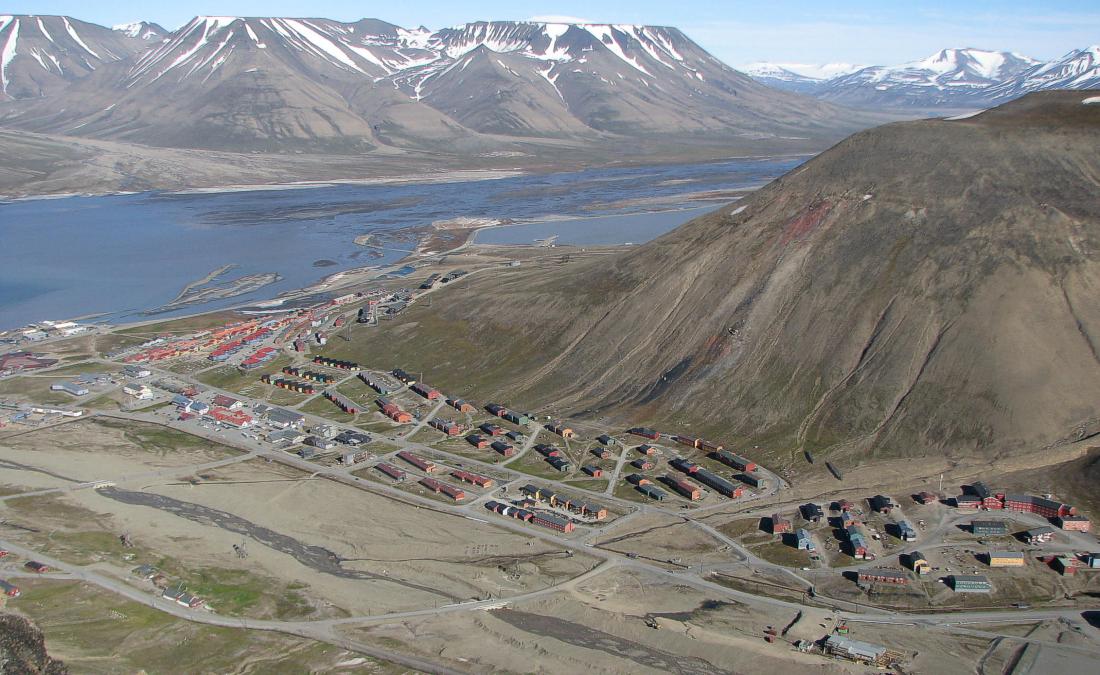
Longyearbyen looking east, 16. July 2007. Winter darkness still prevails
in early February when the experiment was carried out, but this summer picture
provides an impression of the general topographic setting. In the lower part of
the picture the valley Longyeardalen extends to the right (SW), and most of the
buildings in the town is located shortly SE of the valley axis as seen in this
picture. At the extreme left-hand edge of the picture part of UNIS,
the northernmost university in the world, is seen.
The general weather
situation, measurement equipment and measurement route
The
weather was relatively mild, around -5oC, and the sky almost overcast.
Winds were from north, about 11 m/s. The nearby fjord was without ice cover. A
thermistor mounted inside a radiation shield was attached to a 1 m rod,
mounted on a snowmachine (thermistor 1.5 m above terrain). Within
a two hour period, the snowmachine was driven in a dense network across the area
shown in the diagram below, while air temperatures were logged at 5 sec. intervals.
Longyearbyen
is the worlds northernmost town and is located at 78o17'N 11o20'E,
in central
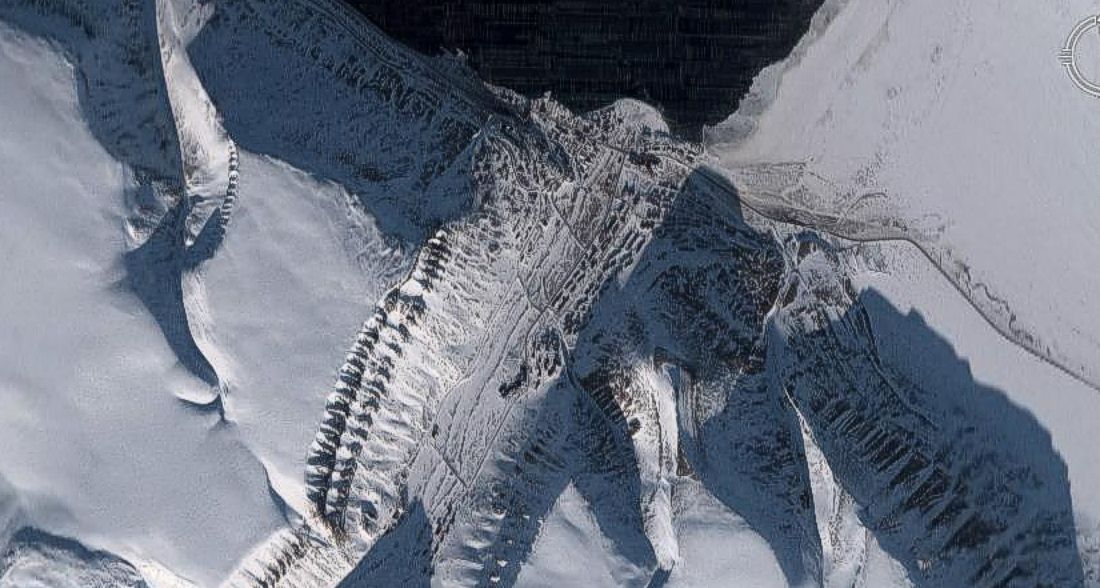
Aerial photo showing Longyearbyen located in the valley
Longyeardalen. Note that shades are falling toward north (up) in this photo.
Source: Google Earth. The photo measures c. 6 km across from west to east.
Results
Result
of temperature measurements in Longyeardalen 2. February 2007. UTM coordinates
are given along the axes. The red dots indicate the position of roads within
Longyearbyen. Most buildings are located along the roads in the northern,
central part of the area shown (compare with the two photos above).
Interpretation of results
The whole
area was snowcovered. The sun
was below the horizon at the time of measurement, and albedo effects caused by
buildings and roads for that reason not important. The local heat islands seen in
the diagram above are therefore interpreted as representing heat escaping from
buildings. The nearby fjord was ice free at the time of measurement, and heat
from the relatively warm sea water may have caused the high temperatures in the
north-western part of the study area, especially as the wind was from northerly
direction.
The temperature pattern shown above does not represent a real snapshot of the temperature conditions, at the whole measuring scheme took almost two hours. As mentioned, the measurements were carried out using a snowmachine, and it can not be excluded that a number of the measurements may have been affected by heat release from the snowmachine itself. In addition, some of the temperature details in the diagram represent artefacts of interpolation, only. The overall temperature pattern, however, presumably is correct.
The
existence of an urban heat island effect in a relatively small settlement as
Longyearbyen may come as a surprise. This is, however, not the first time this
has been observed in the Arctic; see, e.g., Hinkel
et al. 2003.