Volcanoes
and climate
-
The spatial effect of the 1991 Pinatubo eruption on surface air temperature
-
The effect of the 1991 Pinatubo eruption on the mass balance of the Greenland Ice Sheet
-
2007: Scientists find evidence for subsea volcanic blast of CO2
Open Climate4you homepage
Volcanoes
are generally found where tectonic plates are pulled apart or come together. Or
they may be caused by deep seated mantle plumes. These so-called hotspots, for
example at
Volcanic
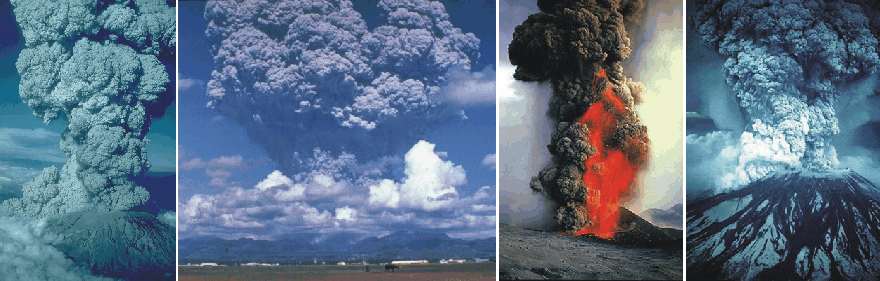
eruptions can alter the climate of the earth for both short and longer periods
of time. For example, average global temperatures dropped about 0.5oC
for about two years after the eruption of
Volcanoes affect the climate through the gases and dust particles thrown into the atmosphere during eruptions. The effect of the volcanic gases and dust may warm or cool the earth's surface, depending on how sunlight interacts with the volcanic material.
Volcanic dust blasted into the atmosphere causes temporary cooling. The amount of cooling depends on the amount of dust, The duration of the cooling depends on the size of the dust particles. Particles the size of sand grains usually fall out of the air in a matter of a few minutes and stay close to the volcano, and therefore have little effect on global climate.
Dust-size
ash particles will float around in the lower atmosphere for hours or days,
causing darkness and cooling directly beneath the ash cloud, but these particles
are quickly washed out of the air by rain. However, dust reaching the dry upper
atmosphere, the stratosphere, can remain for weeks or months before they settle
back to the planet surface. These particles block sunlight and cause cooling
over large areas.
Volcanoes that release large amounts of sulphur compounds like sulphur oxide or sulphur dioxide affect the climate more strongly than other volcanoes mainly ejecting dust. The sulphur compounds usually rise easily into the stratosphere. There they combine with water vapour to form a haze of tiny droplets of sulphuric acid. These tiny droplets are very light in colour and reflect a great deal of incoming sunlight. Although the sulphuric acid droplets eventually may grow large enough to fall to the earth, the stratosphere is so dry that this process usually takes months or even years. Consequently, reflective hazes of sulphur droplets can cause significant global cooling for 2-3 years after a major sulphur-bearing volcanic eruption.
Sulphur
hazes are believed to have been the primary cause of the global cooling that
occurred after the large Pinatubo (1991; see
below) and the Laki
(1783-1785) and Tambora eruptions
(1815).
Volcanoes also release large amounts of water and carbon dioxide, the two most important greenhouse gasses. From an isolated point of view, a volcanic eruption might thus be expected to result in atmospheric warming. However, there are large amounts of water and carbon dioxide in the atmosphere already, and even a large eruption will not be able to change the atmospheric composition of these compounds much. In addition, the water generally condenses out of the atmosphere as rain within a few days, and the carbon dioxide quickly dissolves in the ocean or is absorbed by plants. Usually, the volcanic sulphur compounds therefore have a greater effect, and cooling typically dominates following volcanic eruptions.
Click here to jump back to list of contents.
The 1815 eruption of Tambora was probably the largest eruption in
historic time. About 150 cubic kilometres of ash were erupted. This is about 150
times more than the 1980 eruption of
An estimated 92,000 people were killed by the eruption.
About 10,000 direct deaths were caused by bomb impacts, tephra fall, and
pyroclastic flows, the rest indirectly by starvation, disease, and hunger. The
eruption apparently lowered average world temperature by about 0.5-0.7°C over a
period of 2-3 years. The 1815 eruption of Tambora was followed in North America
and
Central England temperature series 1770-1840. The length of the cooling effect of the Tambora 1815 eruption is indicated by the blue bar. These graphs have been prepared using the composite monthly meteorological series since 1659, originally painstakingly homogenized and published by the late professor Gordon Manley (1974). The data series is now updated by the Hadley Centre and may be downloaded from there by clicking here. A graph showing the entire Central England temperature series since 1659 can be seen by clicking here.
Click here to jump back to list of contents.
The explosive Krakatau eruption in Indonesia 27 May 1883 released huge amounts of ash into the atmosphere, giving rise to spectacular sunrise and sunset phenomena for a couple of years. Several painters have recorded this effect in their artwork.
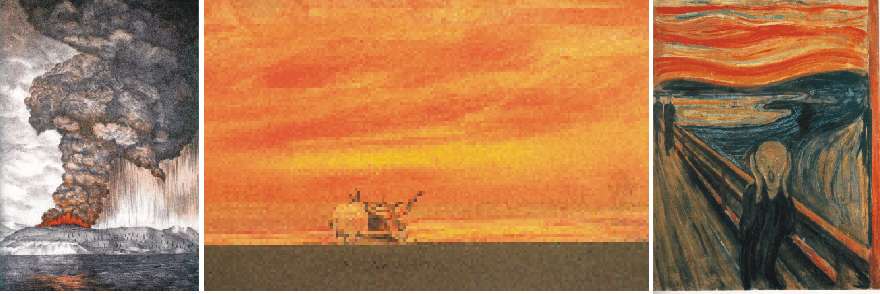
Painting of the Krakatau eruption 27 May 1883 (left). Oil painting 'Sunset' by Thames 23 Nobember 1883 (centre). The painting 'Skrik' (the Scream) 1893 by Edvard Munch (right). The dramatic skyline in this painting is thought to have been inspired by the global optical effects caused by the 1883 Krakatau eruption as seen over Oslofjord in the years thereafter.
Click here to jump back to list of contents.
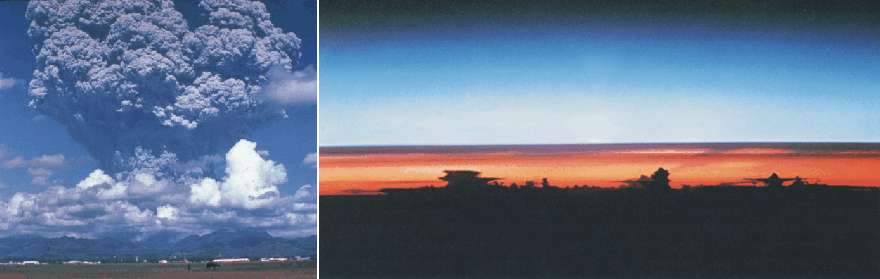
Mt. Pinatubo ash plume June 15, 1991 (left). Red haze in atmosphere caused by the Mt. Pinatubo eruption, as seen from Space Shuttle on August 8, 1991 (right). Pinatubo aerosol clouds (dark) are seen above high cumulonimbus tops.
The 1991 Eruption of Mount Pinatubo, Philippine Islands, was the 2nd largest volcanic eruption during the 20th century. The eruption produced high-speed avalanches of hot ash and gas, giant mudflows, and a huge cloud of volcanic ash hundreds of kilometres across.
On
In
March and April 1991, however, magma rising toward the surface from more than 30
kilometres beneath Pinatubo triggered small earthquakes and on 2 April
1991 caused powerful
steam explosions that blasted three craters on the north flank of the volcano.
Thousands of small earthquakes occurred beneath Pinatubo through April, May, and
early June, and many thousand tons of noxious sulphur dioxide gas were also
emitted by the volcano.
From
June 7 to 12, the first magma reached the surface of
When even more highly gas charged magma reached Pinatubo's surface on June 15, the volcano exploded in a cataclysmic eruption that ejected more than 5 cubic kilometres of material. The ash cloud from this climactic eruption rose nearly 40 kilometres into the air, high into the stratosphere. At lower altitudes, the ash was blown in all directions by the intense cyclonic winds of a coincidentally occurring typhoon, while winds at higher altitudes blew the ash south-westward. A blanket of volcanic ash and larger pumice lapilli blanketed the landscape around the volcano.
HadCRUT3 global monthly temperatures illustrating the effect of the June 1991 volcanic eruption of Mount Pinatubo in the Philippines. The temperature effect apparently lasted to the end of 1992, as indicated by the shaded area.
Some
of the tephra fell on Singapore, over 2000 km away to the southwest. Satellites tracked the ash cloud several times around the
globe. At the same
time, nearly 20 million tons of sulphur dioxide were injected into the
stratosphere by the eruption, and dispersal of this gas cloud around the world
caused global temperatures to drop by about 0.4°C from 1991 to December 1992. Sulphur
dioxide oxidised in the atmosphere to produce a haze of sulphuric acid droplets.
The large stratospheric injection of aerosols resulted in a 5 percent reduction
in sunlight reaching the earth's surface. Global
temperatures dropped about 0.35oC during the next couple of years, as
can be seen from the diagram above.
Diagram showing monthly variations in total global ice and snow cover since July 1983. During the period of observations, the total amount of clouds has varied slightly, reaching a minimum in 1990, followed by a rise presumably caused by the Mount Pinatubo volcanic eruption in 1991. From about 1995, the global ice and snow cover has again decreased slowly. The time labels indicate day/month/year. Data source: The International Sattelite Cloud Climatology Project.
Click here to jump back to list of contents.
The spatial effect of the 1991 Pinatubo eruption on surface air temperature
The clickable diagrams in the table below visually display the spatial change 1991-1993 of monthly surface air temperature following the June 1991 Pinatubo eruption, compared to average conditions during the previous 5 yr period 1987-1991.
|
YEAR |
JAN |
FEB |
MAR |
APR |
MAY |
JUN |
JUL |
AUG |
SEP |
OCT |
NOV |
DEC |
ANN |
|
1991 |
|
|
|
|
|
|
|
|
|
|
|
|
|
|
1992 |
|
|
|
|
|
|
|
|
|
|
|
|
|
|
1993 |
|
|
|
|
|
|
|
|
|
|
|
|
|
Click here to jump back to list of contents.
The
reduced air temperatures during the 1992 northern hemisphere summer had effects
on the mass balance of glaciers. This is well illustrated by a diagram in the 2005
ACIA report (see below), where 1992 becomes an outlier in a statistical
sense. Unfortunately, the special background for the extraordinary low summer
melting 1992 appears not to have been recognised by the authors of the report.
Consequently, the year 1992 and 2002 (another outlier) were erroneously
presented in the ACIA report as visually demonstrating the effect on the
Greenland Ice Sheet of late 20th century warming in the
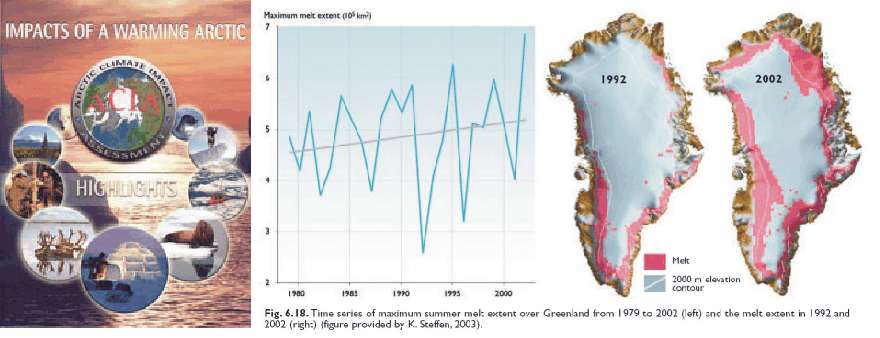
Figures
from the ACIA report (2005), illustrating,
unfortunately without this being stated in the
report, the effect of the Pinatubo eruption on the mass balance of the
Greenland Ice Sheet.
2007: Scientists find evidence for subsea volcanic blast of CO2
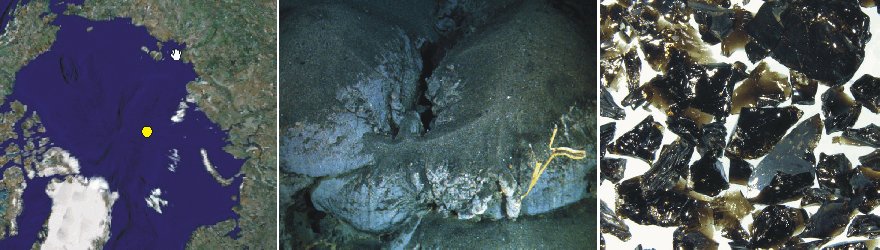
Location of Gakkel Ridge in the Arctic Ocean (yellow dot; left). Fine-grained volcanic debris blanketing the seafloor on the Gakkel Ridge. Grains like these are usually ejected by explosive eruptions and eventually settle through the water onto the seafloor (centre). Glassy, granular fragments of volcanic debris, providing evidence that volcanoes on the Arctic Ocean seafloor had erupted violently (right). Picture source: Google Earth and Carlowicz (2008).
Operating
from the Swedish icebreaker Oden, a research team led by Woods
Hole Oceanographic Institution in 2007 uncovered evidence of explosive
volcanic eruptions on the
“These are the first pyroclastic deposits we've ever found in such deep water,
at oppressive pressures that should inhibit the formation of steam, and many
people thought this was not possible,” said Rob Reves-Sohn, chief scientist of
an expedition to the Gakkel Ridge in July 2007. “This means that a tremendous
blast of carbon dioxide was released into the water column during the explosive
eruption.”
Click here to jump back to list of contents.
Click here to see a list over volcanoes.
Click here to see a list of volcanic eruptions.
Click here to see a list over the largest volcanic eruptions during the last 10,000 years.
Click here to see a list over recent volcanic eruptions, minor as well as large.