Sea Ice
-
MASIE Multisensor Analyzed Sea Ice Extent - Northern Hemisphere
-
Sea ice extension last month compared to the two previous years
Open Climate4you homepage
NSIDC recent Arctic and Antarctic sea ice extent
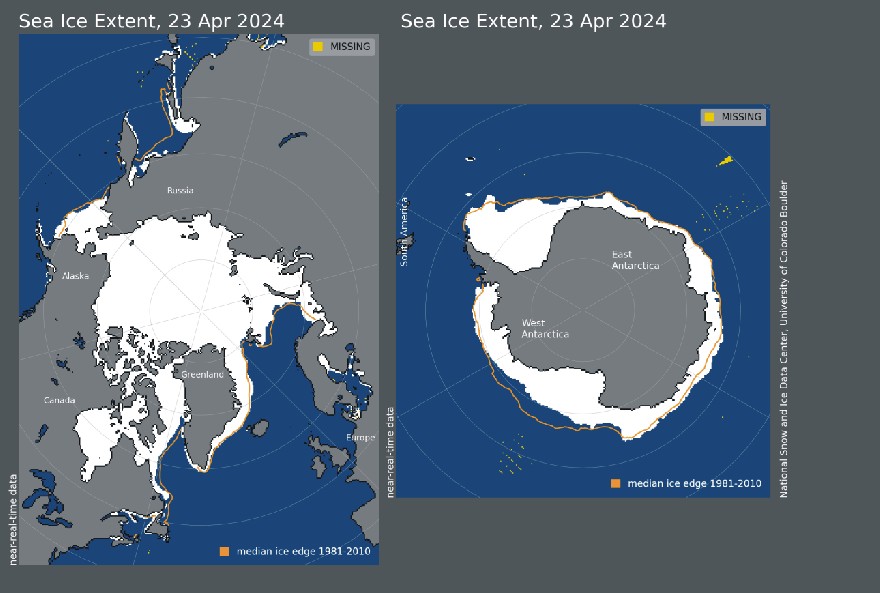
Sea ice extent 2 April 2024. The 'normal' or average limit of sea ice (orange line) is defined as 15% sea ice cover, according to the average of satellite observations 1981-2010 (both years inclusive). Sea ice may therefore well be encountered outside and open water areas inside the limit shown in the diagrams above. Map source: National Snow and Ice Data Center (NSIDC). Please use this link if you want to see the original figures or want to check for more recent updates than shown above. A detailed analysis is also available at this site. Supplementary Arctic sea ice maps are available here.
Graphs showing daily Arctic (left) and Antarctic (right) sea ice extent until 2 April 2024. Diagrams from National Snow and Ice Data Center (NSIDC). Baseline period 1981-2010 (both years inclusive). Please note that the two scales for ice extent are different. Please use this link if you want to see the original figures or want to check for more recent updates than shown above. A detailed analysis is also available at this site.
Click here to go to a discussion of the two opposite trends shown in the diagrams above.
Click here to jump back to the list of contents.
IRAC JAXA recent Arctic sea ice extent
2023 2024
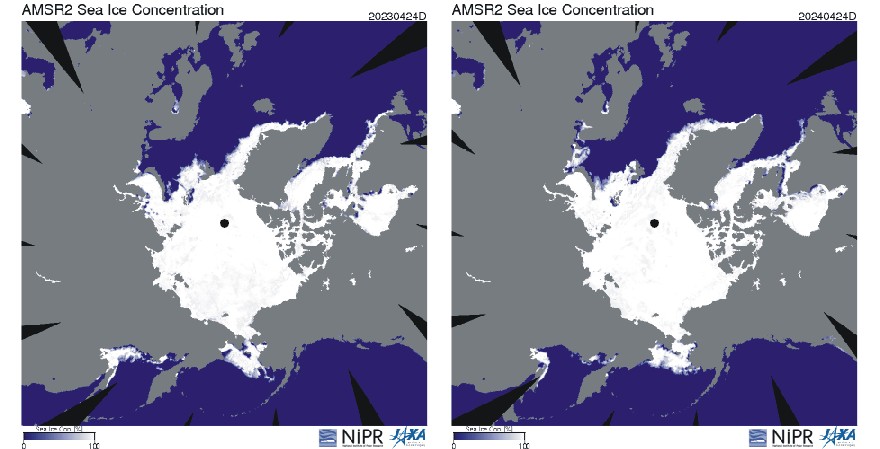
Diagrams showing Arctic sea ice extent and concentration 3 April 2023 (left) and 2024 (right), by courtesy of Japan Aerospace Exploration Agency (JAXA). The IARC-JAXA Information System is a geoinformatics facility for satellite image analysis and computational modeling/visualization in support of international collaboration in arctic and global change research at the International Arctic Research Center (IARC) in corporation with the Japan Aerospace Exploration Agency (JAXA) and the Advanced Earth Science and Technology Organization of Japan (AESTO). Please use this link if you want to see the original version of the diagrams shown above, or want to make other comparisons.
Graph showing daily Arctic sea ice extent since June 2002, by courtesy of Japan Aerospace Exploration Agency (JAXA). The IARC-JAXA Information System is a geoinformatics facility for satellite image analysis and computational modelling/visualization in support of international collaboration in arctic and global change research at the International Arctic Research Center (IARC) in corporation with the Japan Aerospace Exploration Agency (JAXA) and the Advanced Earth Science and Technology Organization of Japan (AESTO). The thin blue line indicates the daily Arctic sea ice extent, while the thick line indicates the running 365 day average sea ice extent. Last day shown: 3 April 2024.
-
Click here to download the entire IRAC JAXA daily Arctic sea ice extent data series since 1 June 2002.
-
Click here to read about data smoothing.
Click here to jump back to the list of contents.
DMI recent Arctic sea ice extent and thickness
Diagrams showing Arctic sea ice extent 3 April 2024 and the seasonal cycles of the calculated total arctic sea ice volume, according to The Danish Meteorological Institute (DMI). The mean sea ice volume and standard deviation for the period 2004-2013 are shown by grey shading. Please use this link if you want to see the original version of the diagrams shown above, or want to make other comparisons.
2023 2024
Diagrams showing Arctic sea ice extent 3 April 2023 (left) and 2024 (right) and the seasonal cycles of the calculated total arctic sea ice volume, according to The Danish Meteorological Institute (DMI). The mean sea ice volume and standard deviation for the period 2004-2013 are shown by grey shading. Please use this link if you want to see the original version of the diagrams shown above, or want to make other comparisons.
Please note that DMI on 7 December 2021 changed their sea ice calculation model. Details of the change can be found here: http://polarportal.dk/en/sea-ice-and-icebergs/sea-ice-thickness-and-volume/
Read more on this change here and here.
Other sources for Arctic Sea Ice Cover monitoring:
Click here to jump back to the list of contents.
MASIE Multisensor Analyzed Sea Ice Extent - Northern Hemisphere

MASIE Northern Hemisphere sea ice extent on 2 April 2024. Latest figure update: 4 April 2024.
Daily Northern Hemisphere sea ice extension according to MASIE. See regional sea ice maps below. Latest diagram update: 4 April 2024.
REGIONAL MASIE SEA ICE EXTENSION
MASIE
Northern Hemisphere sea ice regions. 1
= Beaufort Sea; 2 = Chukchi
Sea; 3 = East Siberian Sea; 4 = Laptev
Sea; 5 = Kara Sea; 6 = Barents
Sea; 7 = Greenland Sea; 8 = Baffin
Bay and Gulf of St. Lawrence; 9 = Canadian
Archipelago; 10 = Hudson Bay; 11 = Central
Arctic; 12 = Bering Sea; 13 = Baltic
Sea; 14 = Sea of Okhotsk; 15 = Yellow
Sea; 16 = Cook Inlet.
Daily sea ice extension in the Beaufort Sea according to MASIE. See location map above. Latest diagram update: 4 April 2024.
Daily sea ice extension in the Chukchi Sea according to MASIE. See location map above. Latest diagram update: 4 April 2024.
Daily sea ice extension in the East Siberian Sea according to MASIE. See location map above. Latest diagram update: 4 April 2024.
Daily sea ice extension in the Laptev Sea according to MASIE. See location map above. Latest diagram update: 4 April 2024.
Daily sea ice extension in the Kara Sea according to MASIE. See location map above. Latest diagram update: 4 April 2024.
Daily sea ice extension in the Barents Sea according to MASIE. See location map above. Latest diagram update: 4 April 2024.
Daily sea ice extension in the Greenland Sea according to MASIE. See location map above. Latest diagram update: 4 April 2024.
Daily sea ice extension in the Baffin Bay and Gulf of St. Lawrence according to MASIE. See location map above. Latest diagram update: 4 April 2024.
Daily sea ice extension in the Canadian Archipelago according to MASIE. See location map above. Latest diagram update: 4 April 2024.
Daily sea ice extension in the Hudson Bay according to MASIE. See location map above. Latest diagram update: 4 April 2024.
Daily sea ice extension in the Central Arctic Ocean according to MASIE. See location map above. Latest diagram update: 4 April 2024.
Daily sea ice extension in the Bering Sea according to MASIE. See location map above. Latest diagram update: 4 April 2024.
Daily sea ice extension in the Baltic Sea according to MASIE. See location map above. Latest diagram update: 4 April 2024.
Daily sea ice extension in the Sea of Okhotsk according to MASIE. See location map above. Latest diagram update: 4 April 2024.
Daily sea ice extension in the Yellow Sea according to MASIE. See location map above. Latest diagram update: 4 April 2024.
Daily sea ice extension in the Cook Inlet according to MASIE. See location map above. Latest diagram update: 4 April 2024.
Click here to jump back to the list of contents.
Polar surface pressure, wind and temperatures
When following the change in surface area of the Arctic and Antarctic sea ice (diagrams above) it is instructive to compare with current surface air pressure, wind and air temperatures as measured over the Poles.
-
Click here to open a map showing the latest surface wind and air temperatures in the Arctic.
-
Click here to open a map showing the latest surface air pressure and air temperatures in the Arctic.
-
Click here to open a map showing the latest surface wind and air temperatures in the Antarctic.
-
Click here to open a key to common meteorological symbols used in the above maps.
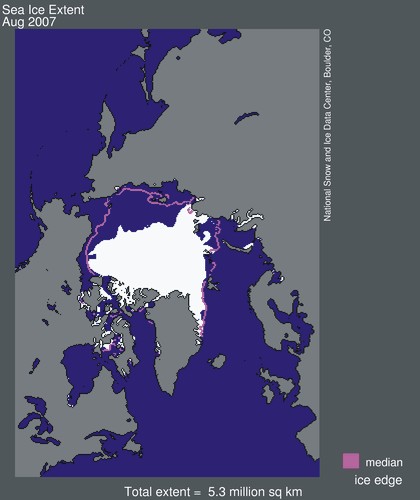
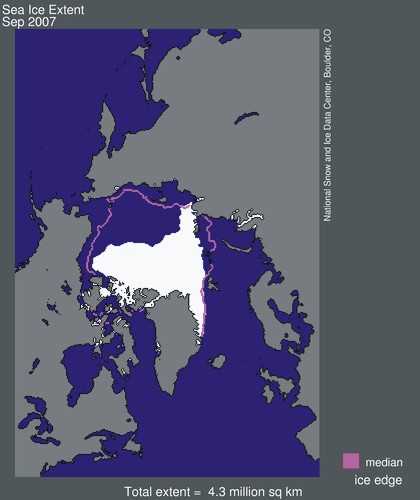
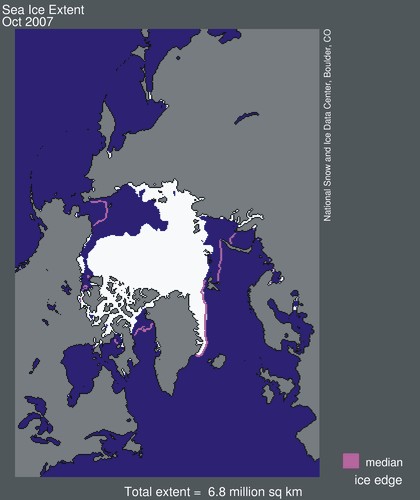
The
The Arctic sea ice decreased to a record low level in
2007, since satellite observations began in 1979. The
decline in the Arctic sea ice from 2005 to 2007 was caused by winds, according
to a
NASA study. Atmospheric pressure conditions set up wind patterns that
compressed the old thick sea ice, loaded it into the Transpolar Drift Stream and then
increased its flow rate out of the
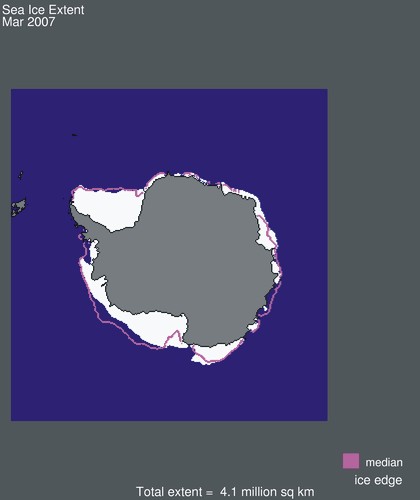
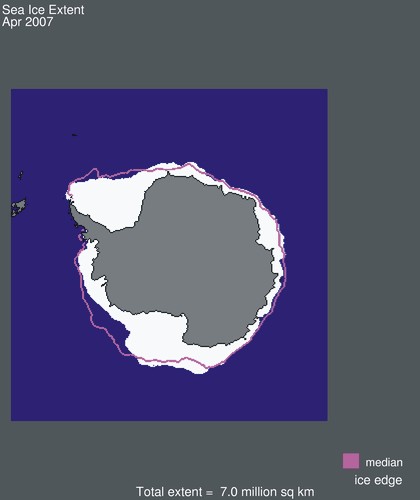
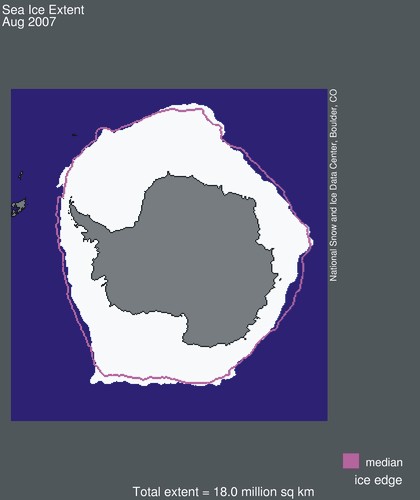
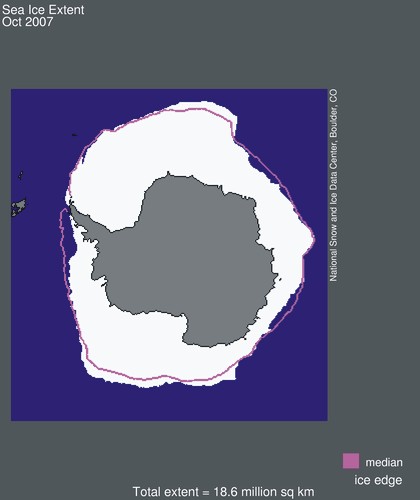
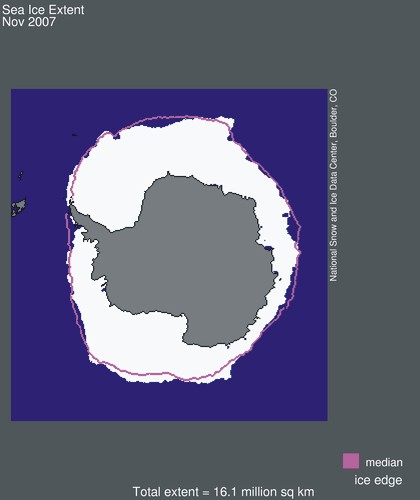
The Antarctic sea ice increased to a
record high level in 2007, since satellite observations began in 1979. Part of
the explanation for this development is presumably the cold 2007 winter in the
Southern Hemisphere, with cold and snow records set in
Click here to jump back to the list of contents.
Sea ice extension last month compared to the two previous years
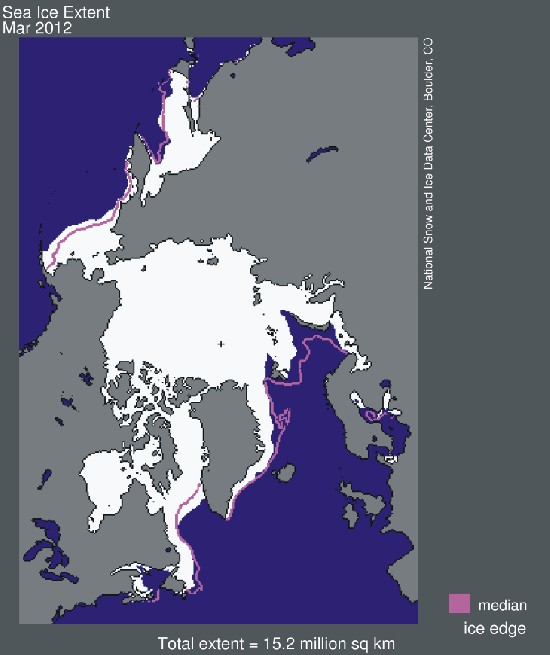
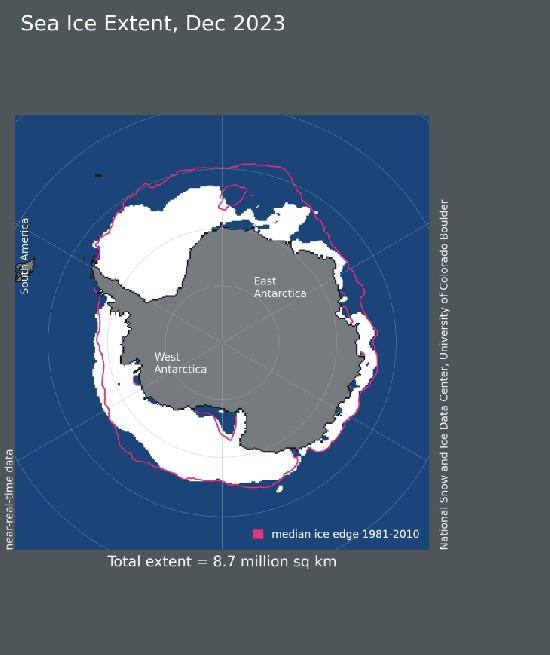
2022 2023 2024
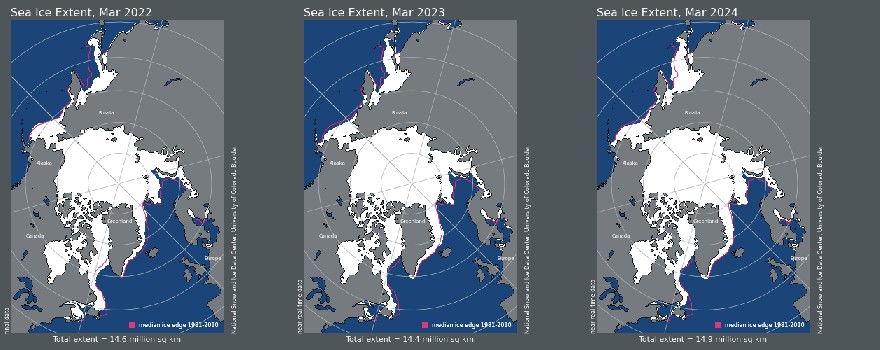
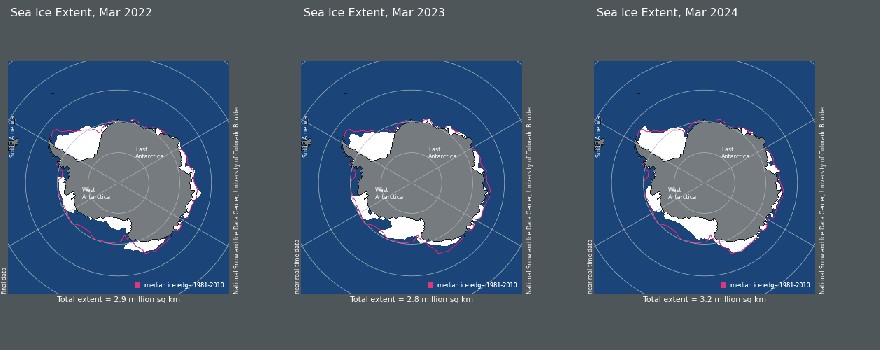
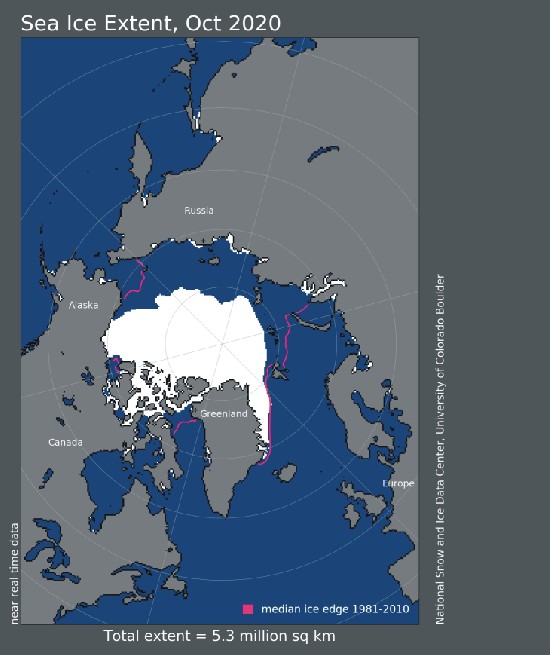
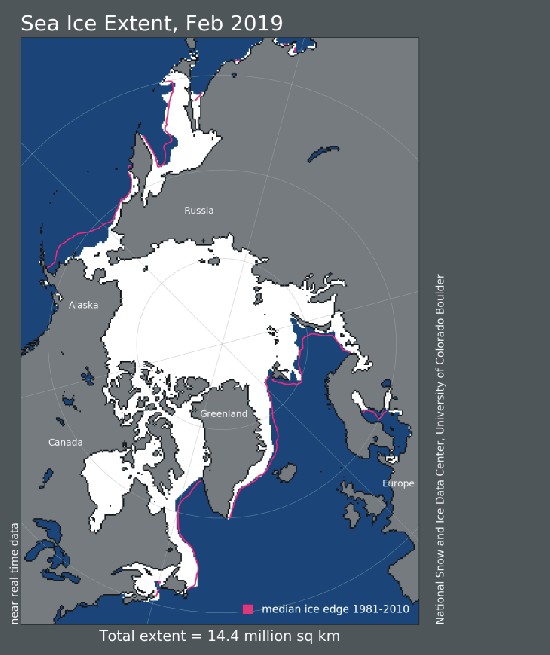
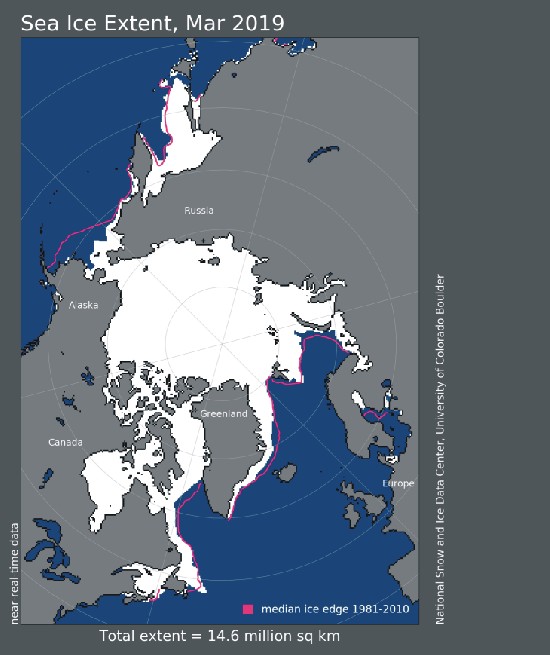
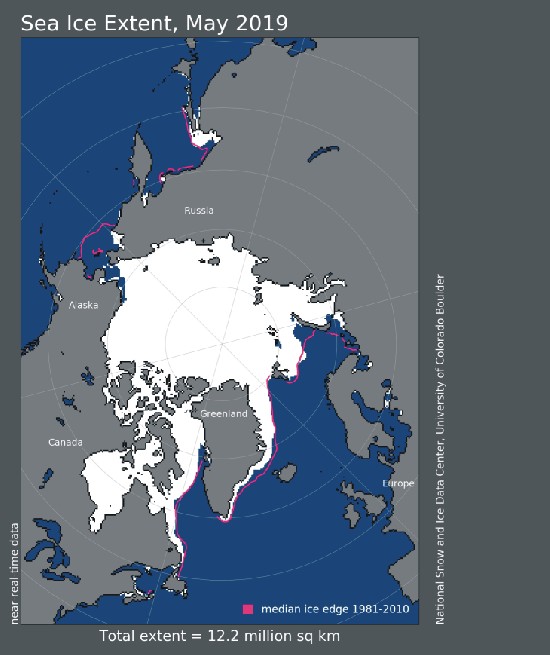
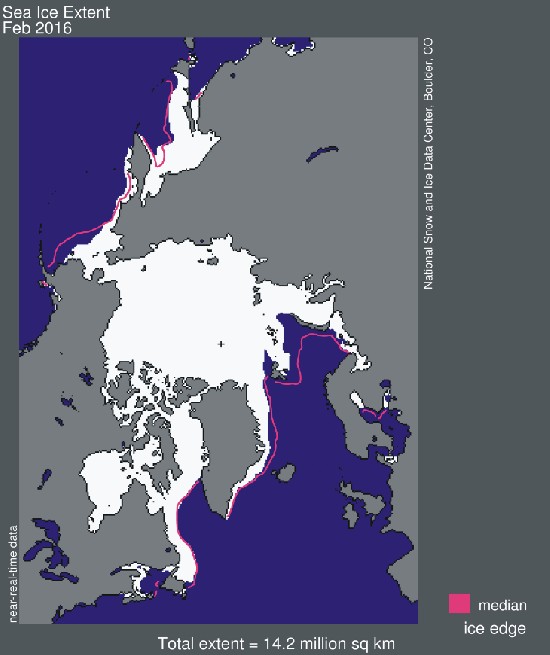
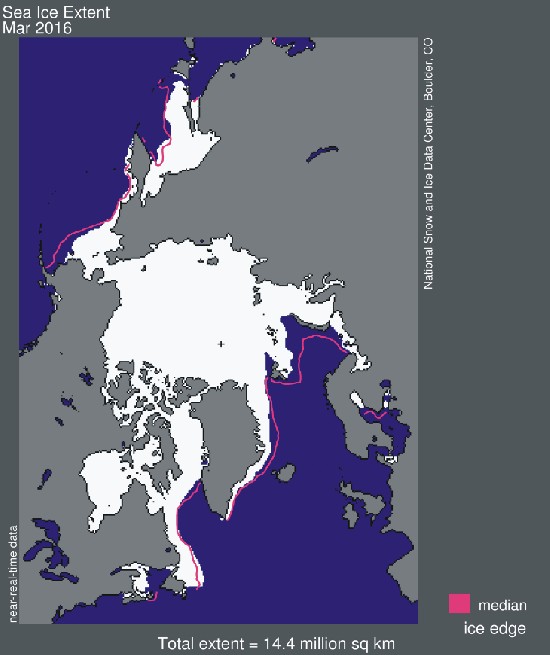
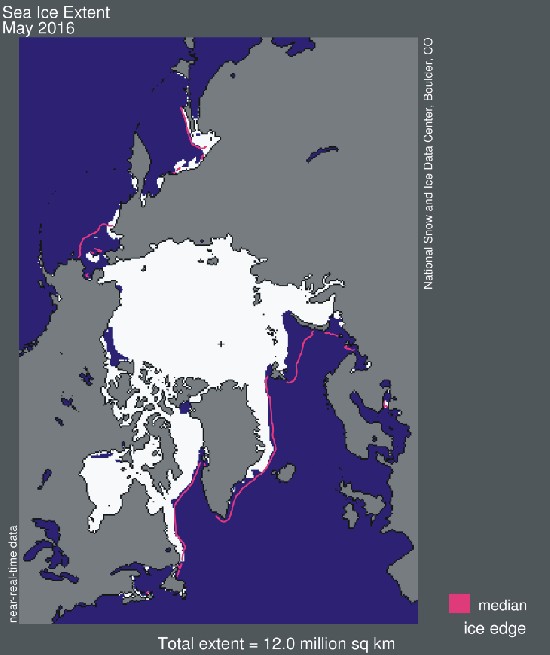
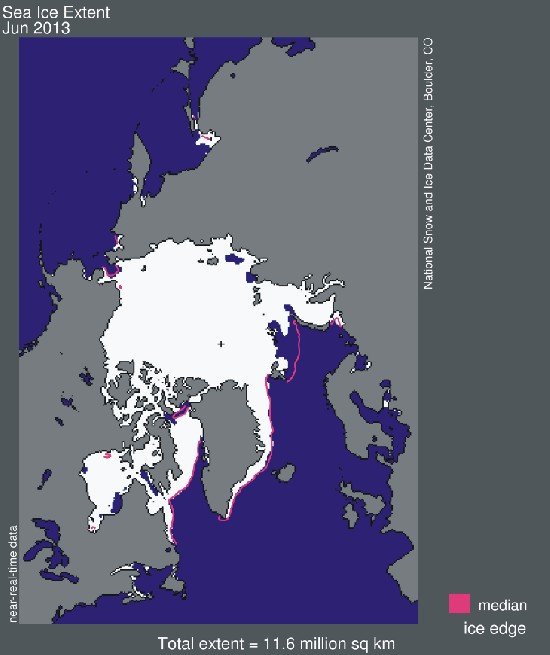
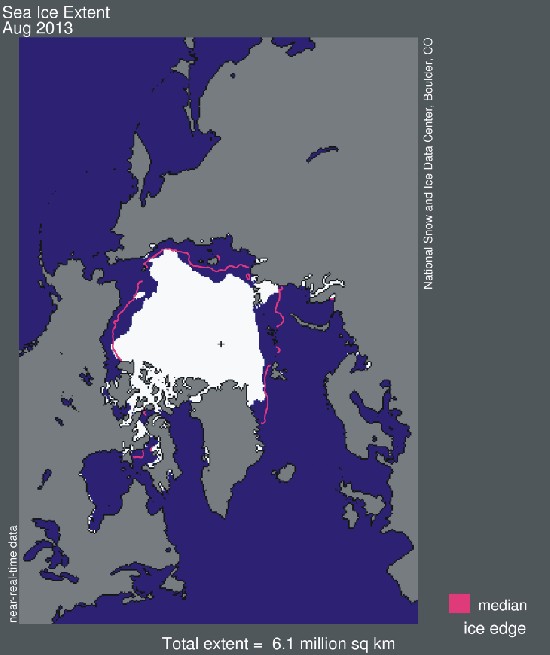
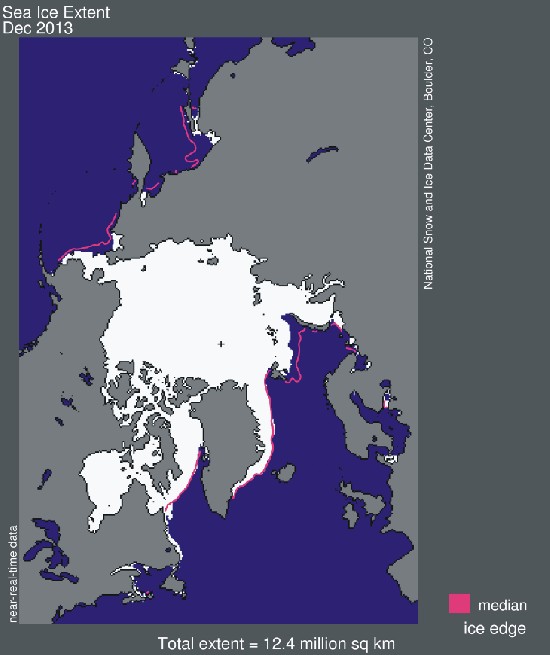
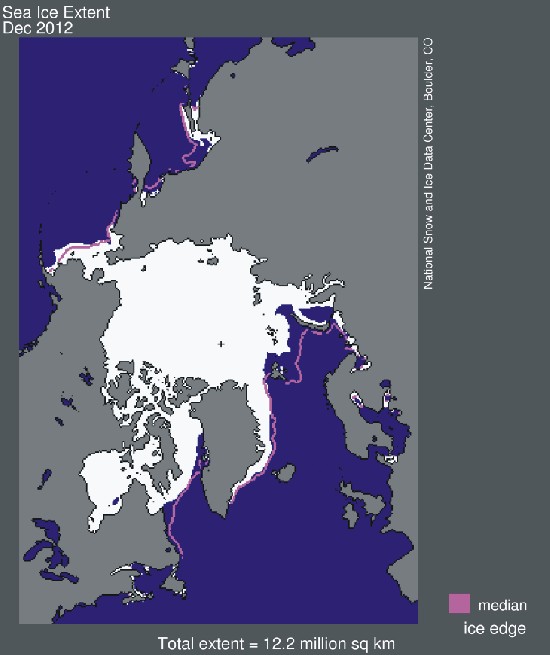
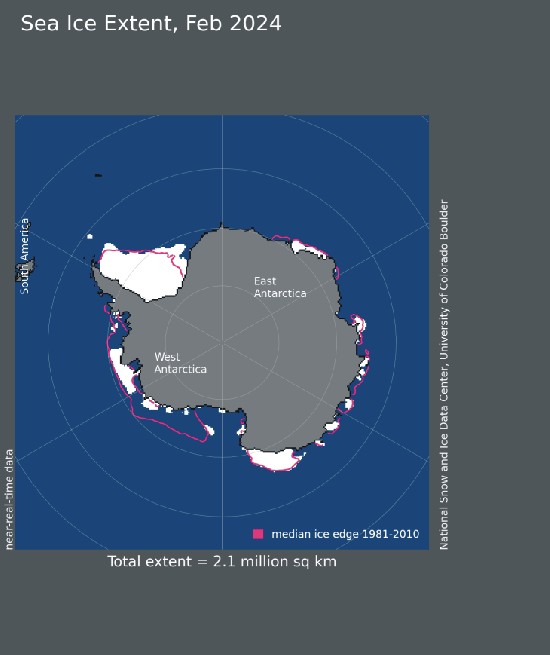
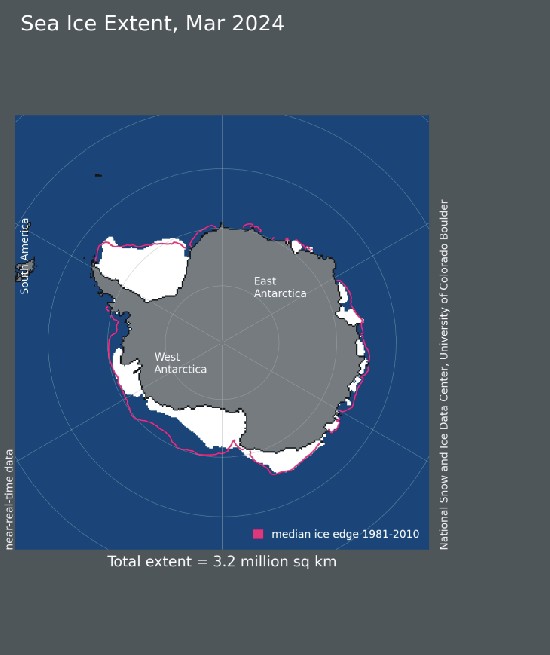
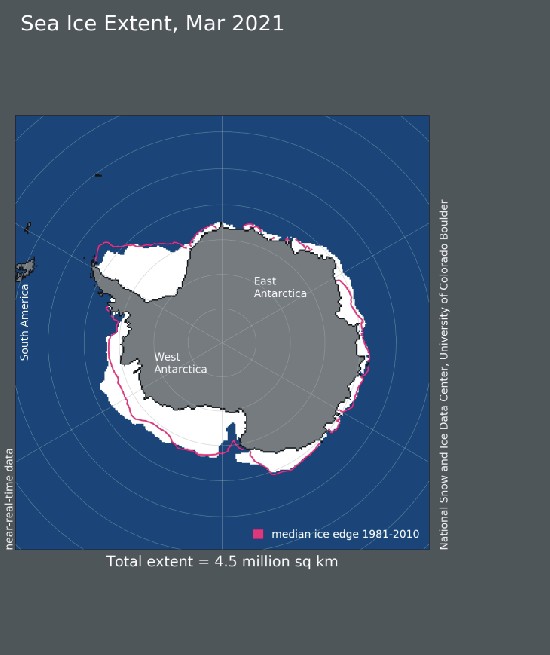
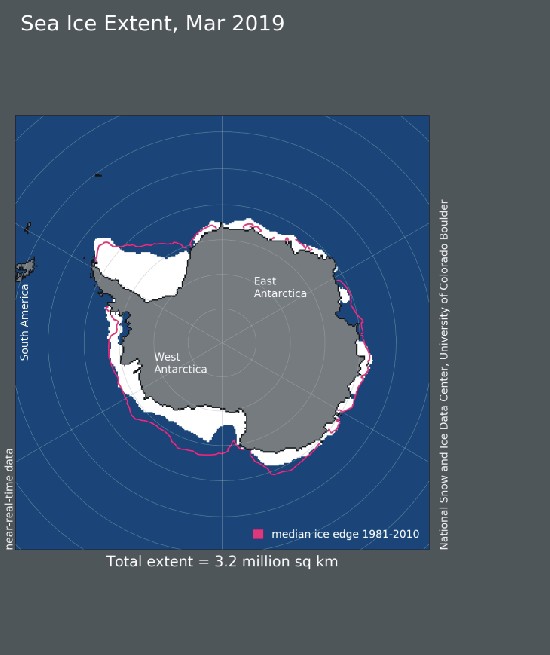
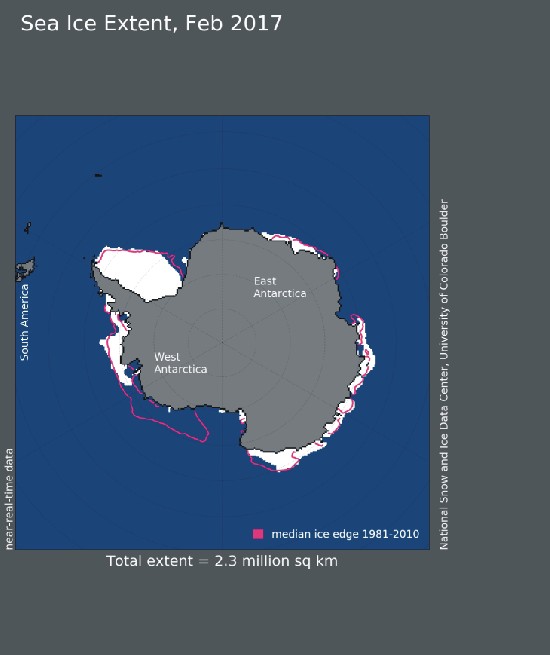
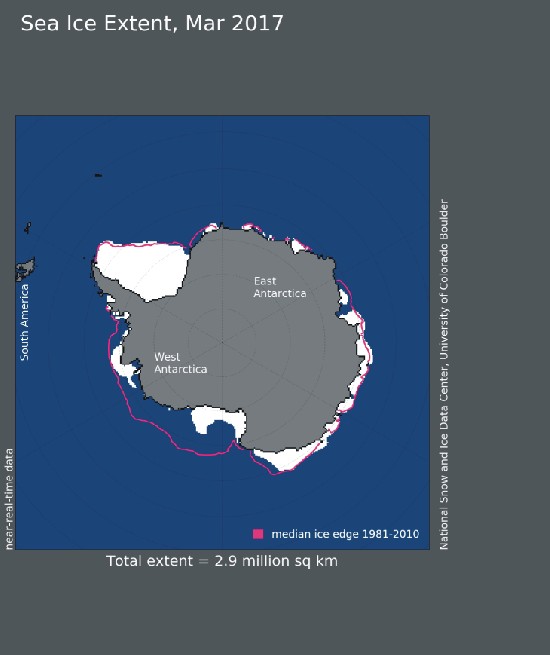
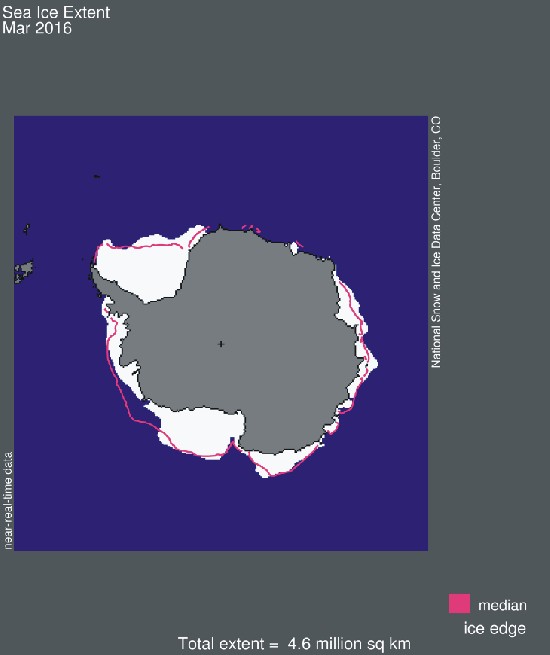
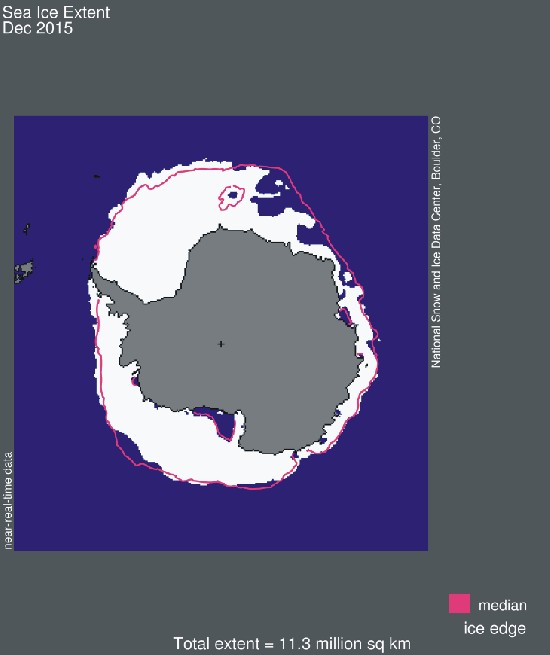
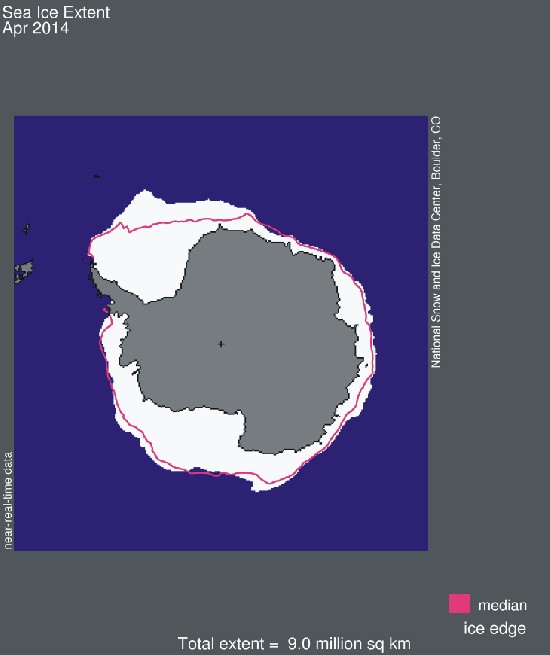
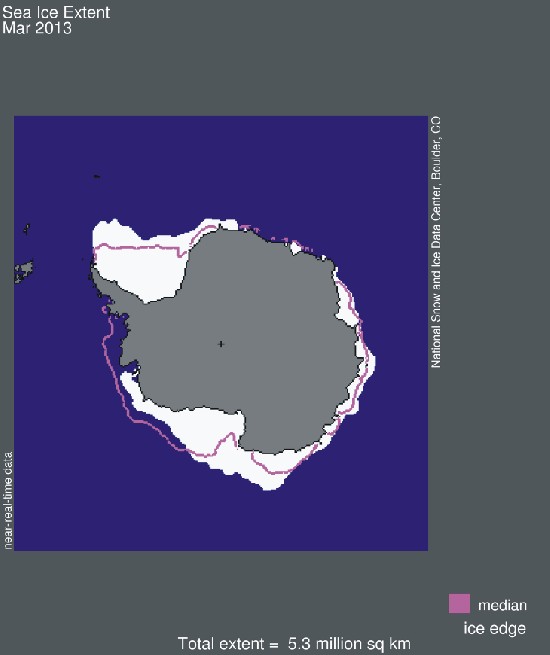
March 2022, 2023 and 2024 (left to right) sea ice extent in both hemispheres. The 'normal' limit of sea ice (purple line) is defined as 15% sea ice cover, according to satellite observations since November 1978. Sea ice may therefore well be encountered outside and open water areas inside the limit shown in the diagrams above. The total area of sea ice is indicated in square kilometres below each map. Map source: National Snow and Ice Data Center (NSIDC). Please use this link if you want to see the original figures or want to check for more recent updates than shown above. A detailed analysis is also available at this site. Latest figure update: 9 April 2024.
Click here to jump back to the list of contents.
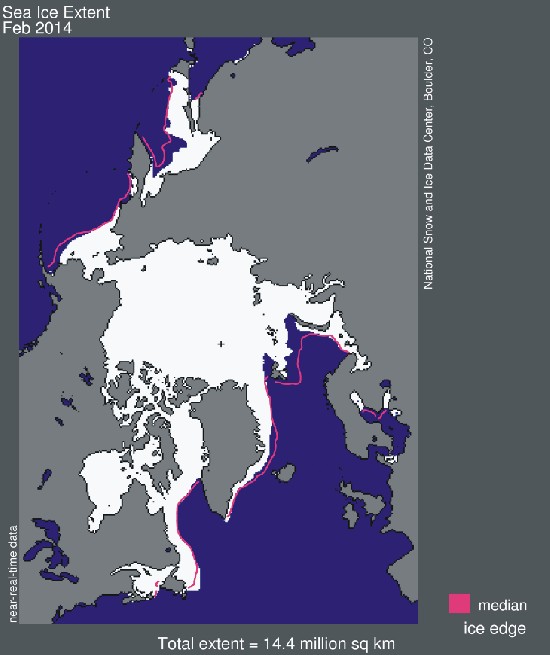
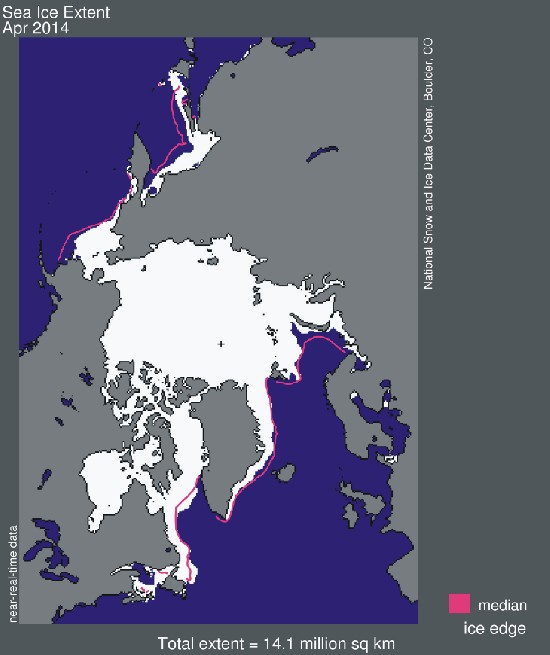
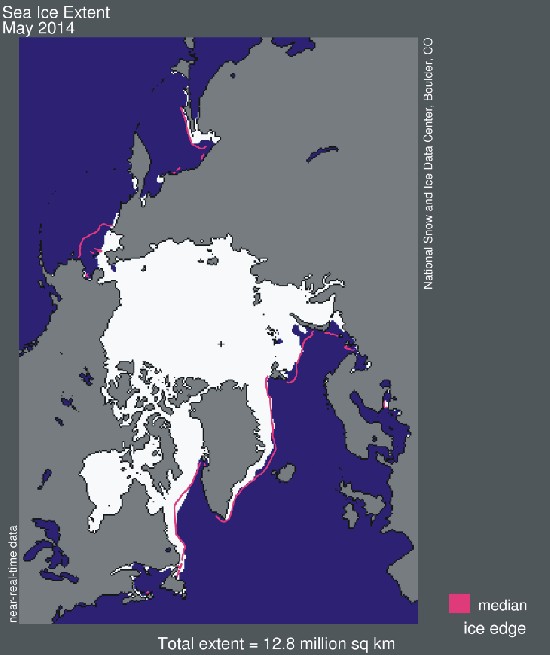
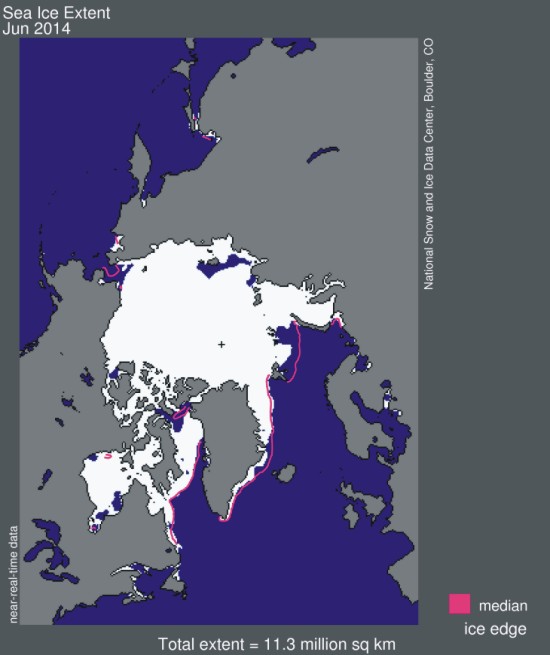
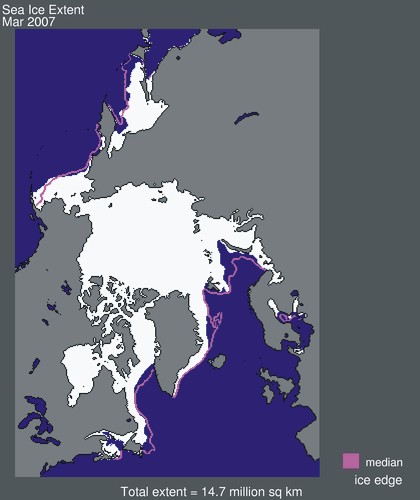
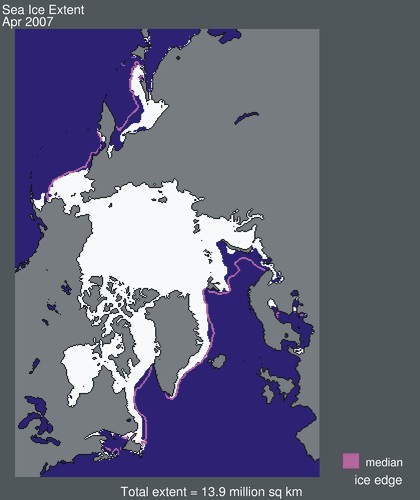
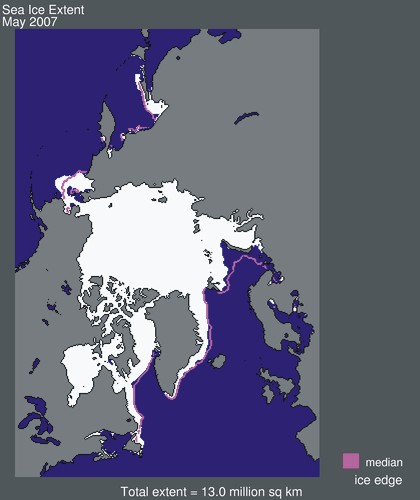
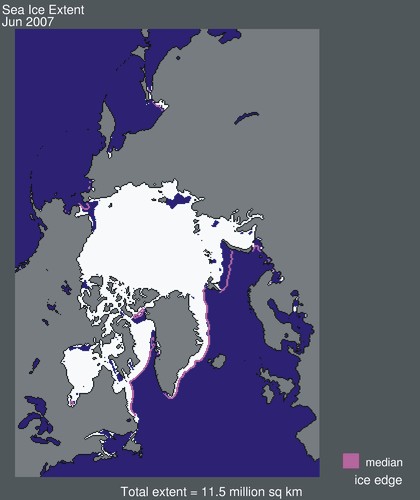
Northern hemisphere monthly sea ice map table
| YEAR | JAN | FEB | MAR | APR | MAY | JUN | JUL | AUG | SEP | OCT | NOV | DEC |
| 2024 |  |
 |
 |
|||||||||
| 2023 |  |
 |
 |
 |
 |
 |
 |
 |
 |
 |
 |
 |
| 2022 | 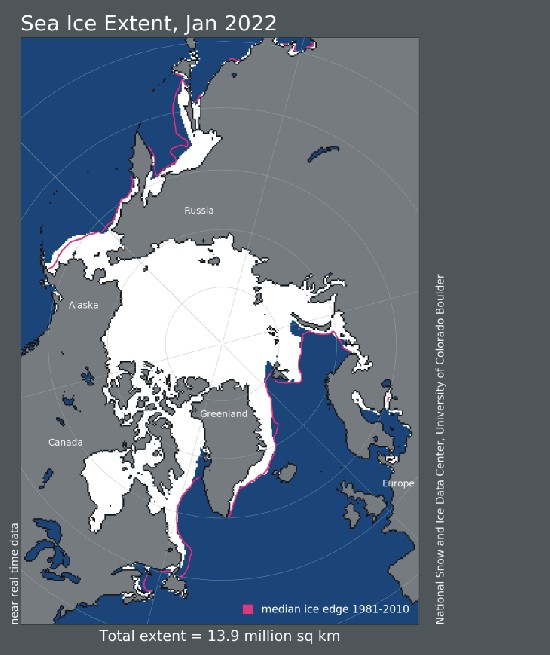 |
 |
 |
 |
 |
 |
 |
 |
 |
 |
 |
 |
| 2021 |  |
 |
 |
 |
 |
 |
 |
 |
 |
 |
 |
 |
| 2020 |  |
 |
 |
 |
 |
 |
 |
 |
 |
 |
 |
 |
| 2019 |  |
 |
 |
 |
 |
 |
 |
 |
 |
 |
 |
 |
| 2018 | 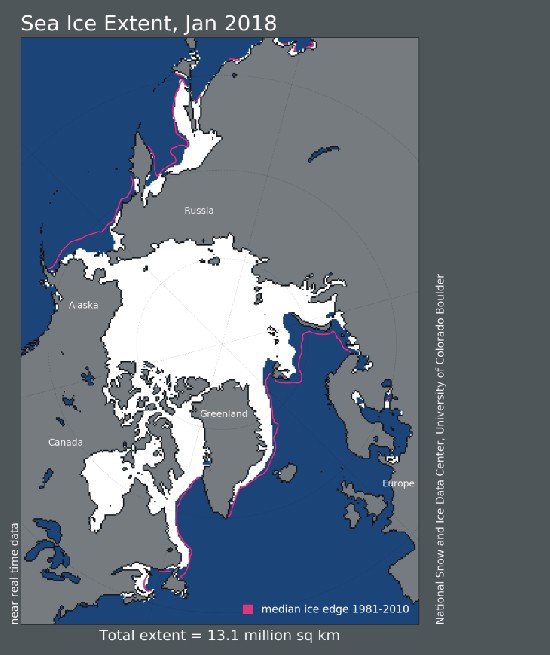 |
 |
 |
 |
 |
 |
 |
 |
 |
 |
 |
 |
| 2017 | 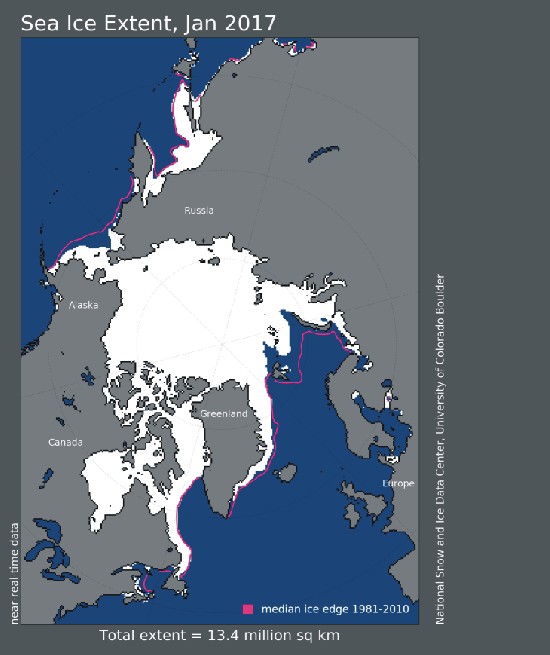 |
 |
 |
 |
 |
 |
 |
 |
 |
 |
 |
 |
| 2016 | 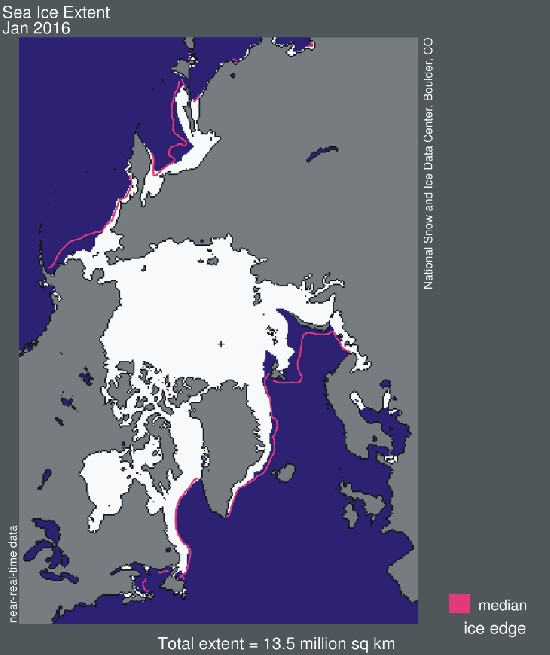 |
 |
 |
 |
 |
 |
 |
 |
 |
 |
 |
 |
| 2015 | 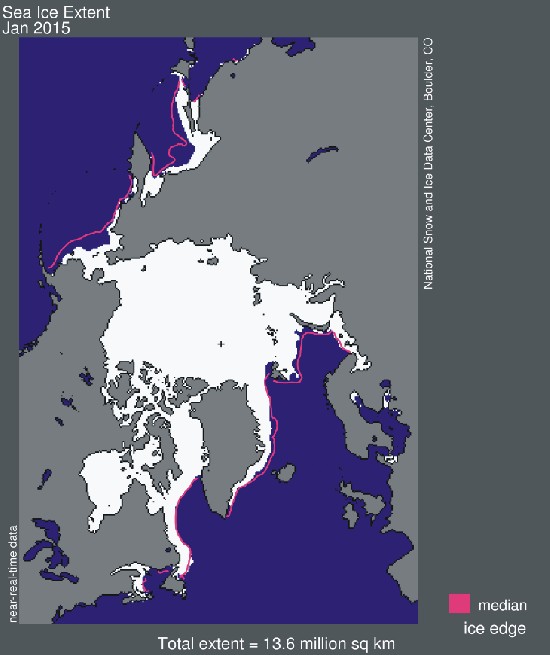 |
 |
 |
 |
 |
 |
 |
 |
 |
 |
 |
 |
| 2014 |  |
 |
 |
 |
 |
 |
 |
 |
 |
 |
 |
 |
| 2013 | 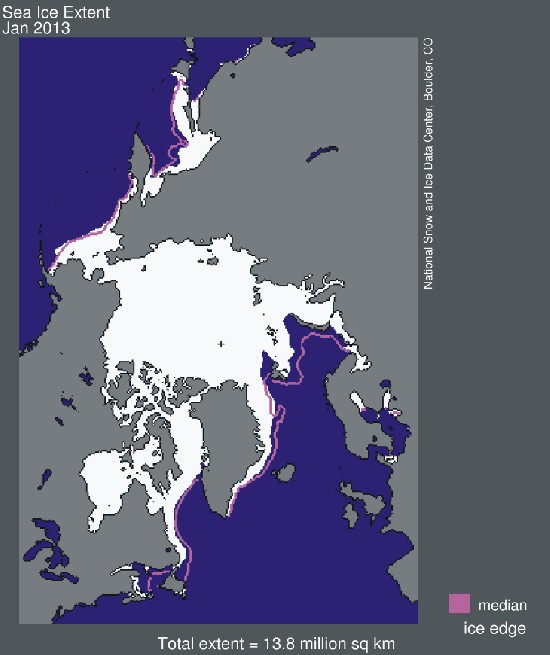 |
 |
 |
 |
 |
 |
 |
 |
 |
 |
 |
 |
| 2012 |  |
 |
 |
 |
 |
 |
 |
 |
 |
 |
 |
 |
| 2011 |  |
 |
 |
 |
 |
 |
 |
 |
 |
 |
 |
 |
| 2010 | 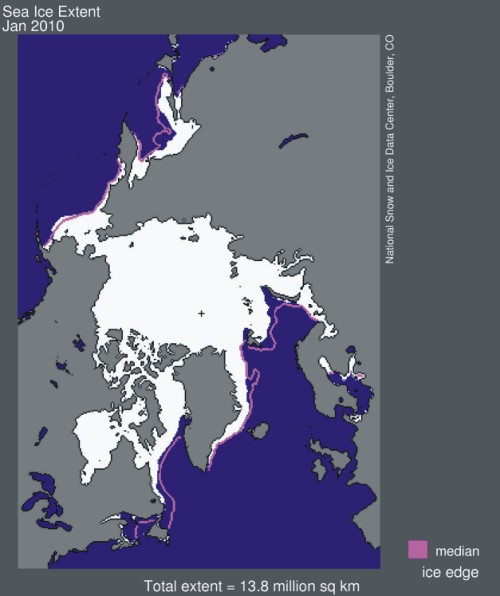 |
 |
 |
 |
 |
 |
 |
 |
 |
 |
 |
 |
| 2009 | 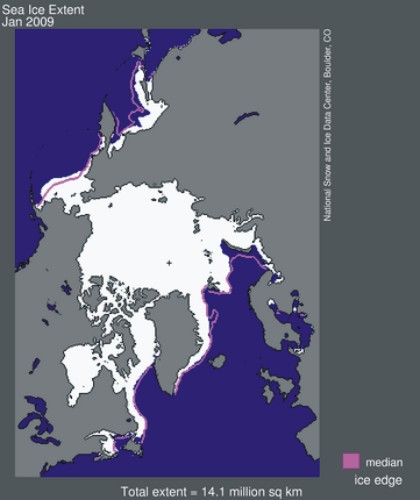 |
 |
 |
 |
 |
 |
 |
 |
 |
 |
 |
 |
| 2008 | 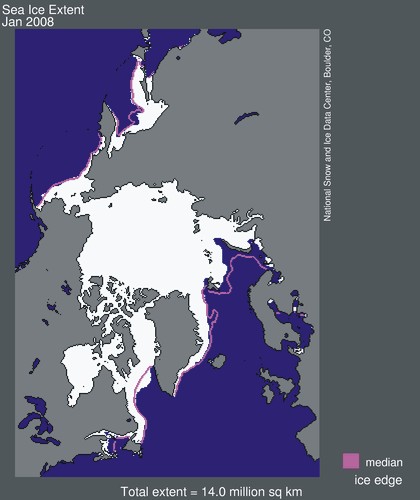 |
 |
 |
 |
 |
 |
 |
 |
 |
 |
 |
 |
| 2007 | 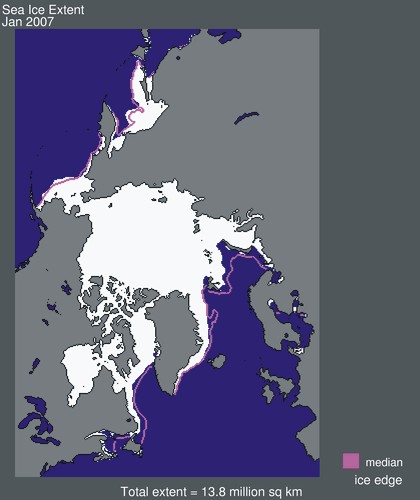 |
 |
 |
 |
 |
 |
 |
 |
 |
 |
 |
 |
| 2006 | 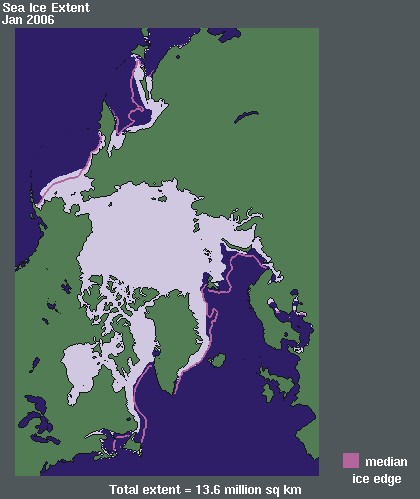 |
 |
 |
 |
 |
 |
 |
 |
 |
 |
 |
 |
| 2005 | 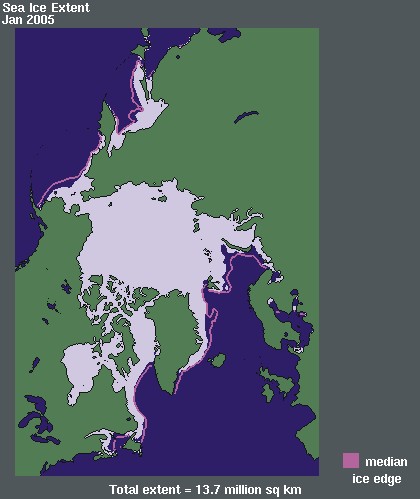 |
 |
 |
 |
 |
 |
 |
 |
 |
 |
 |
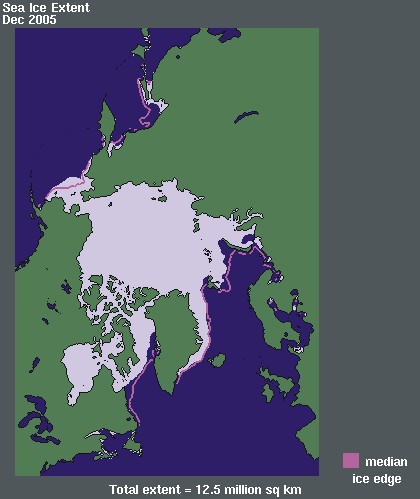 |
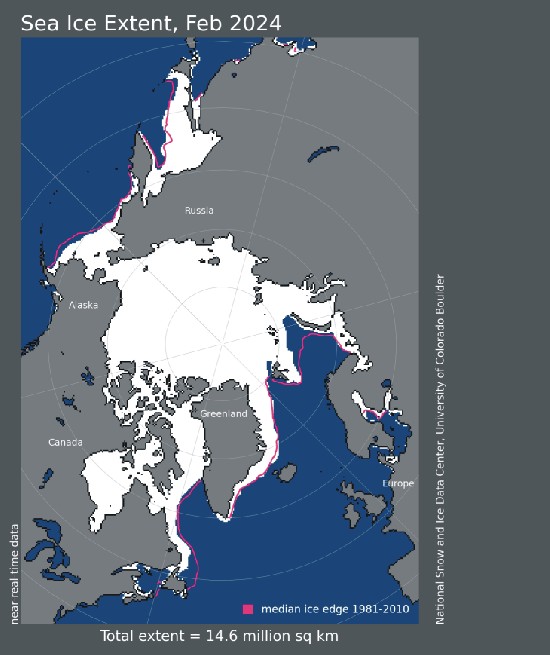
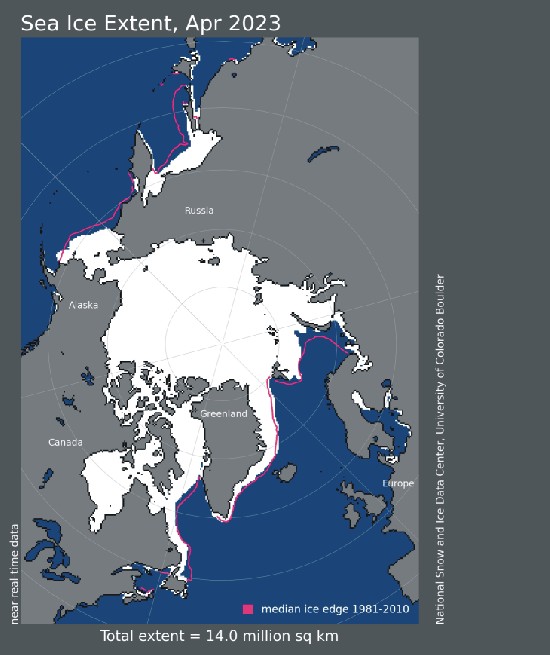
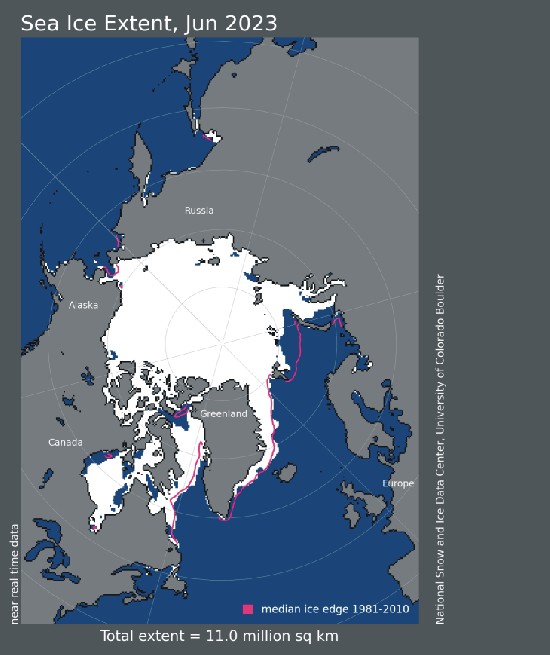
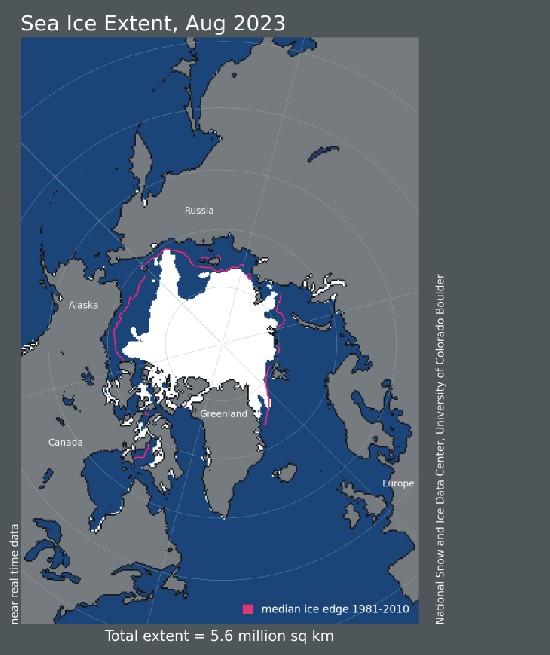
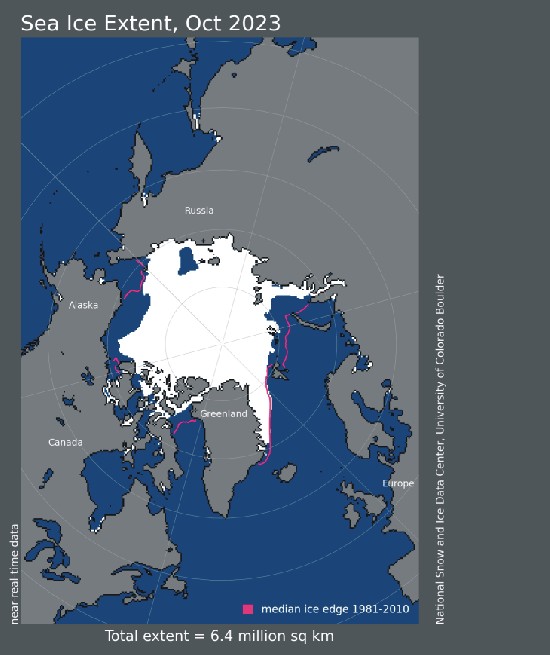
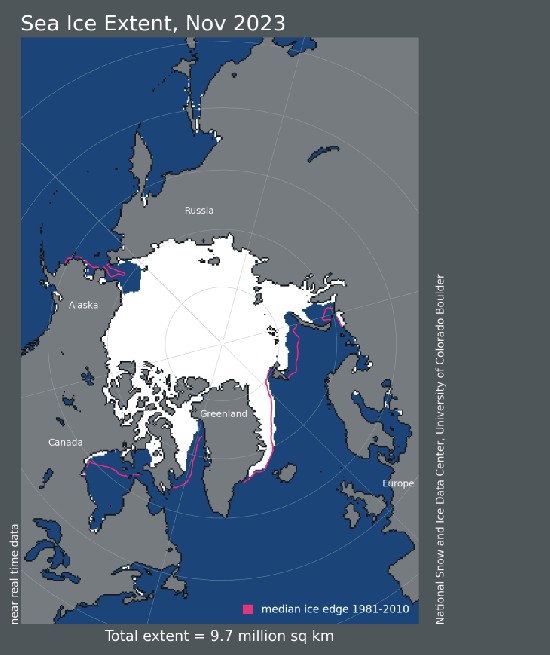
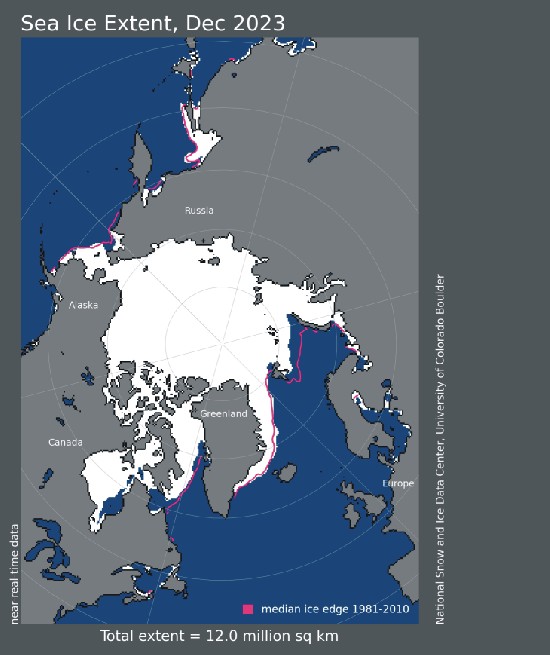
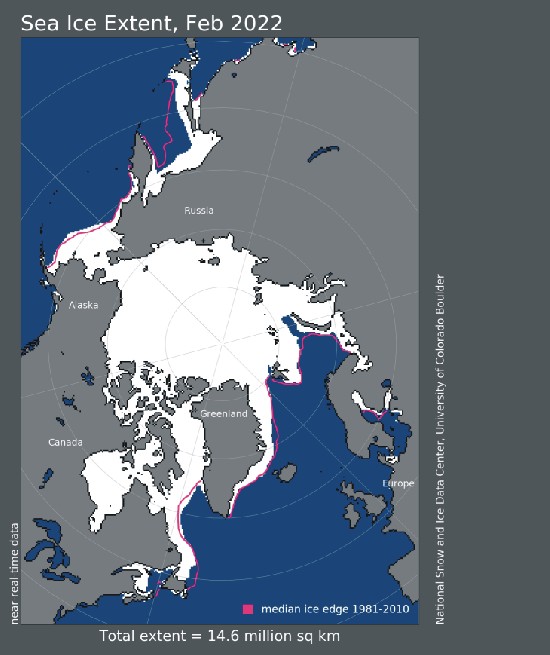
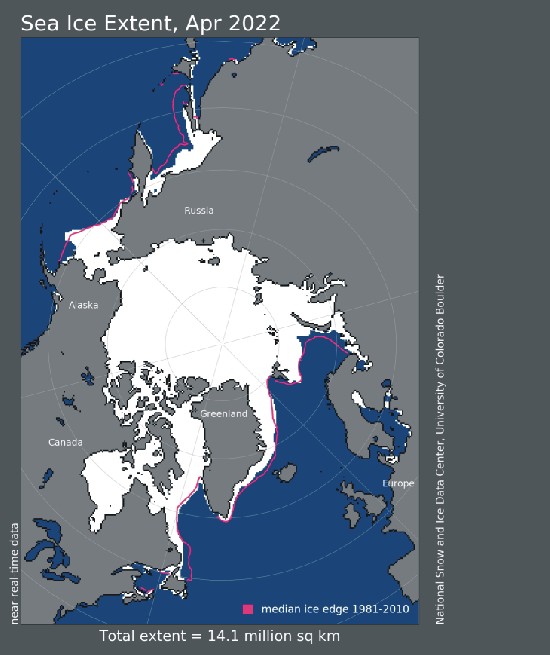
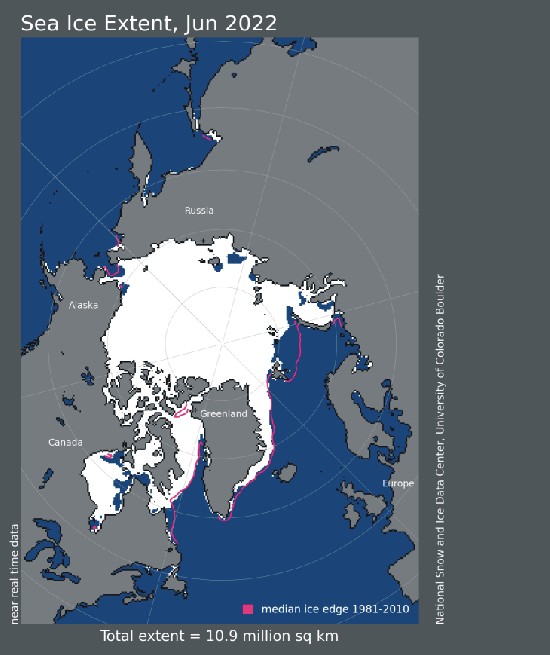
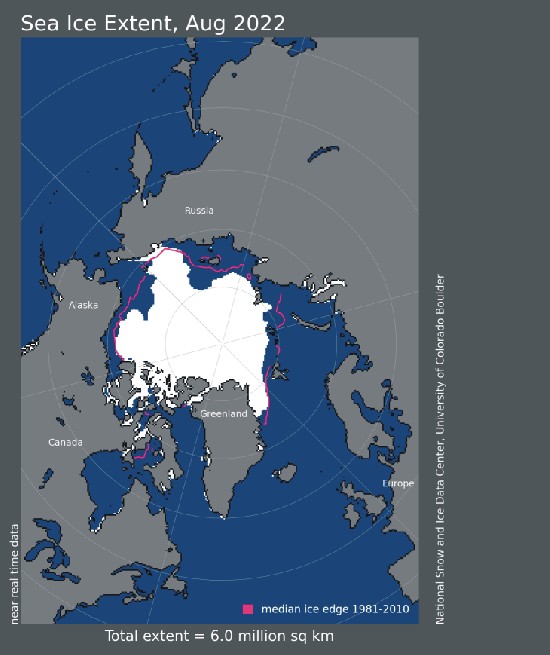
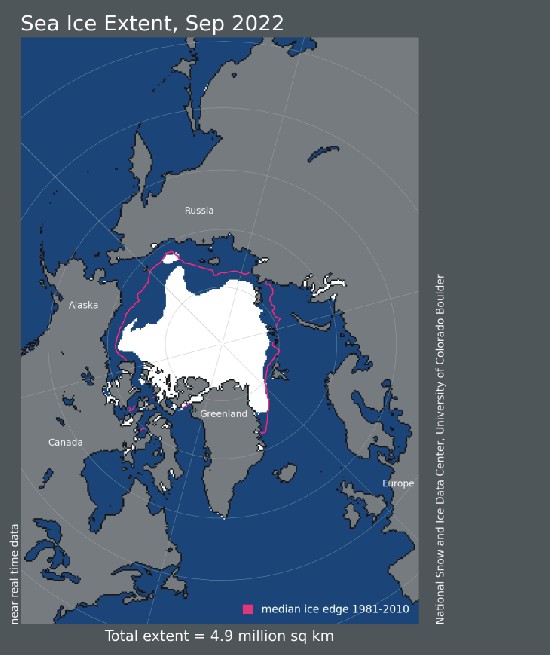
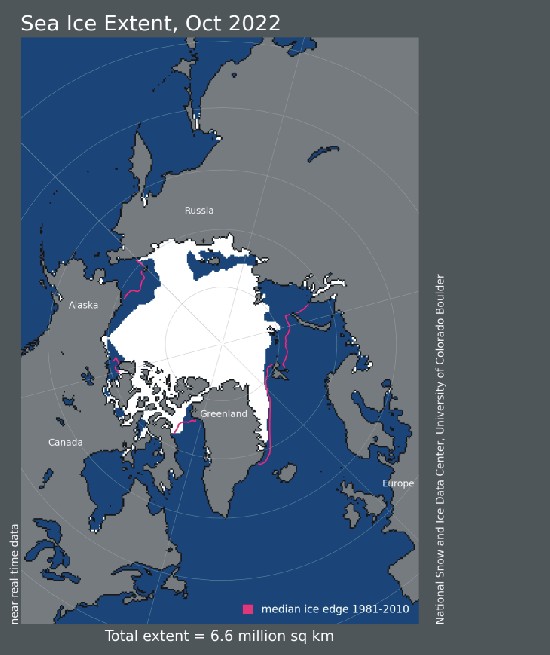
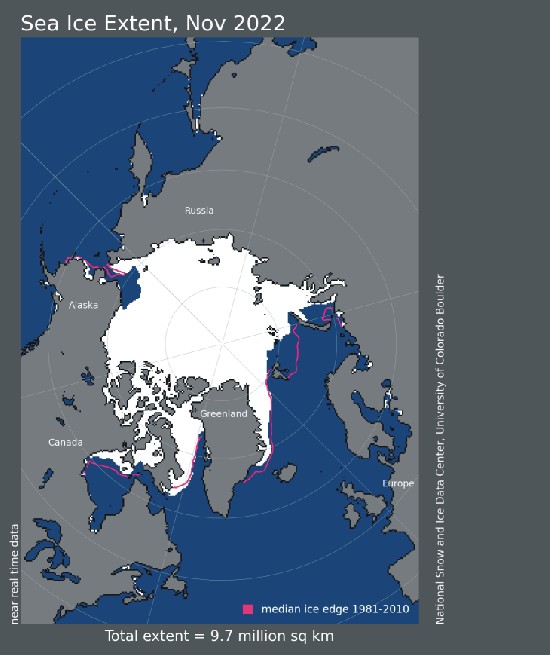
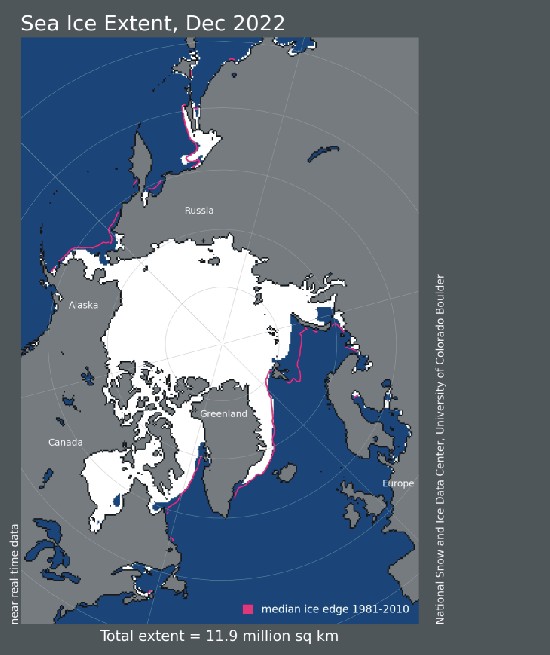
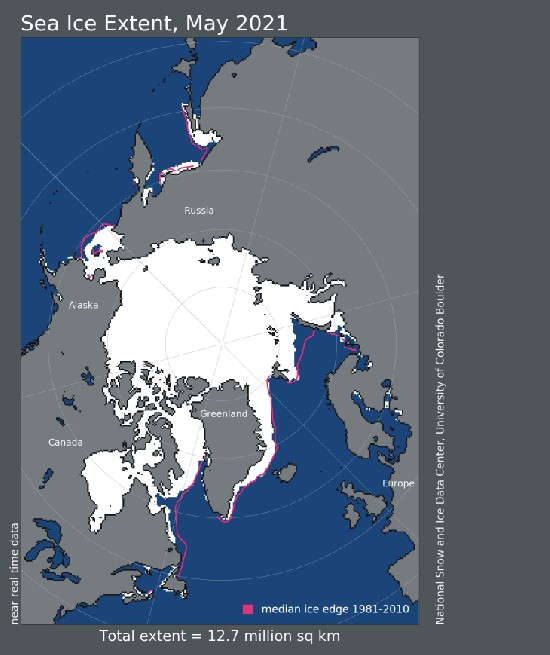
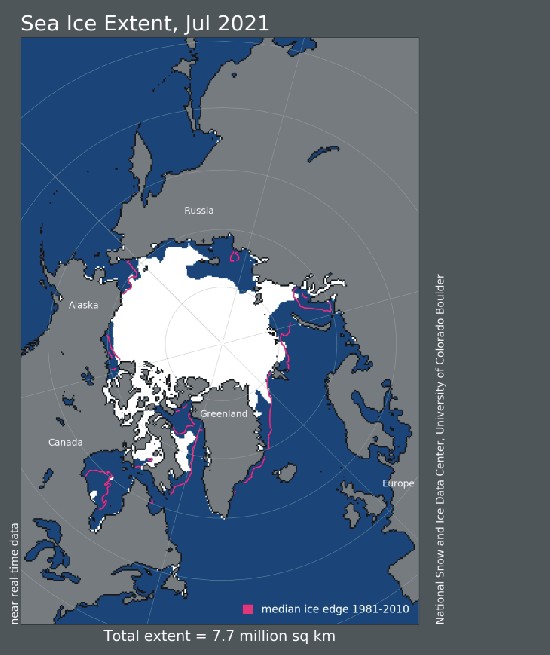
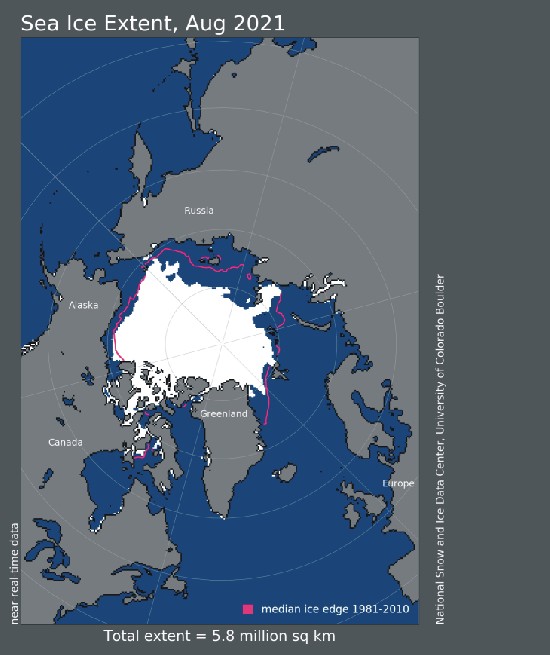
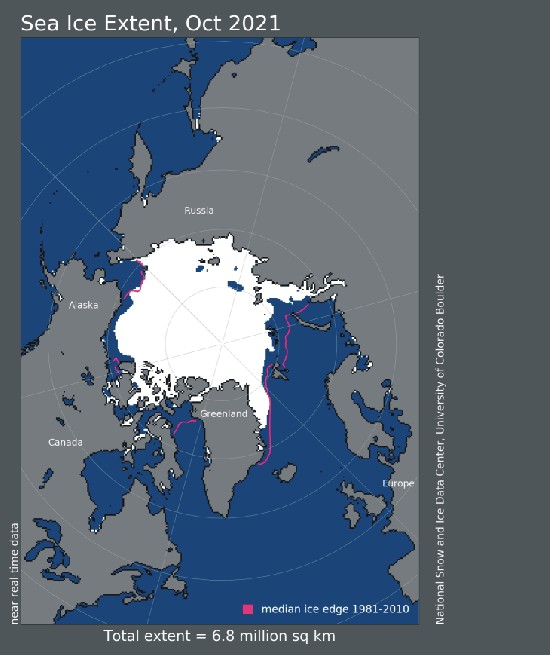
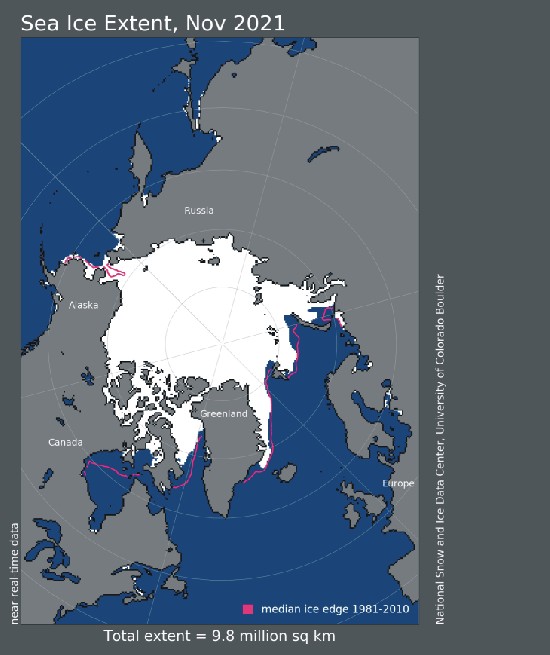
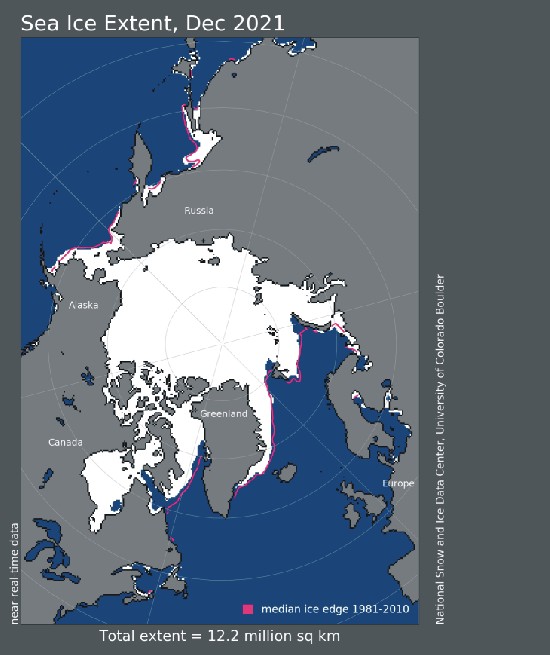
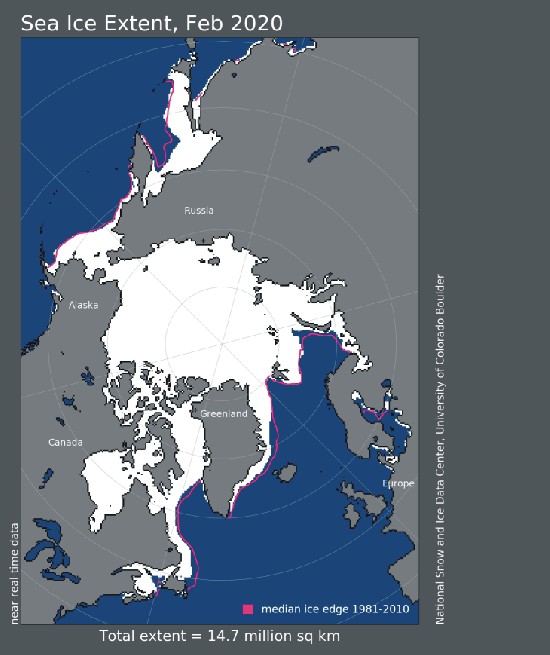
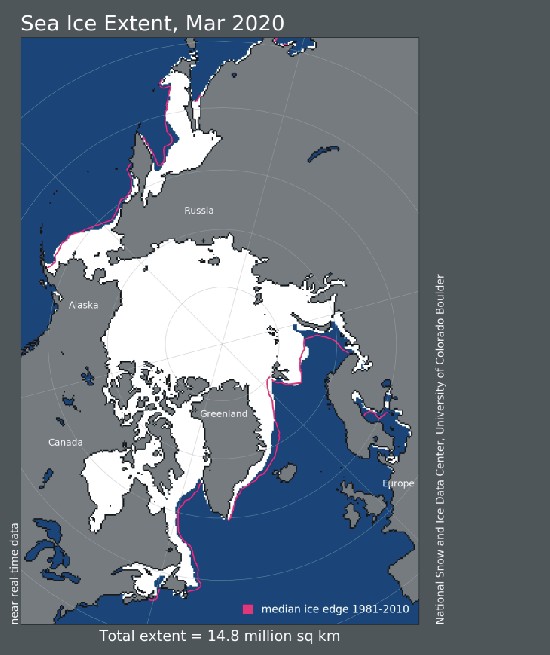
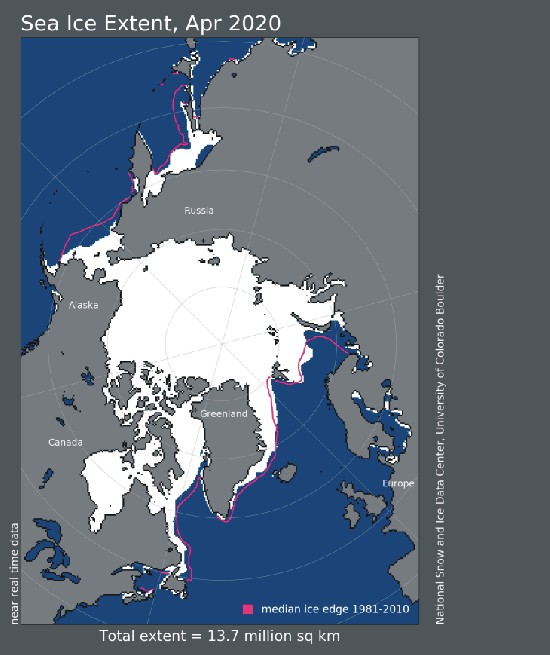
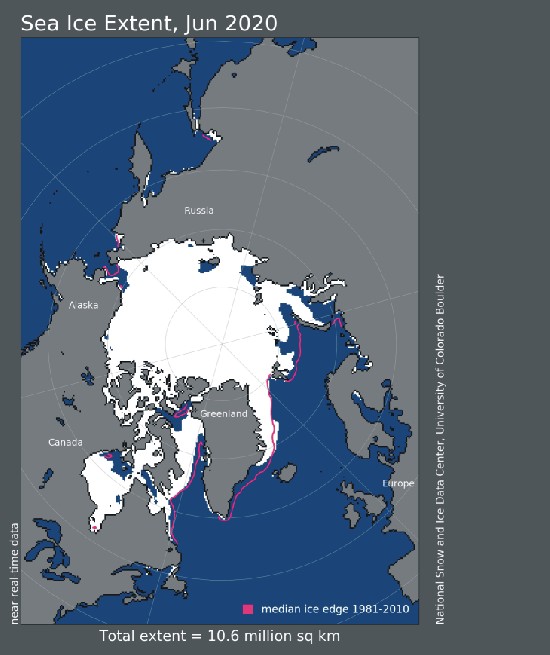
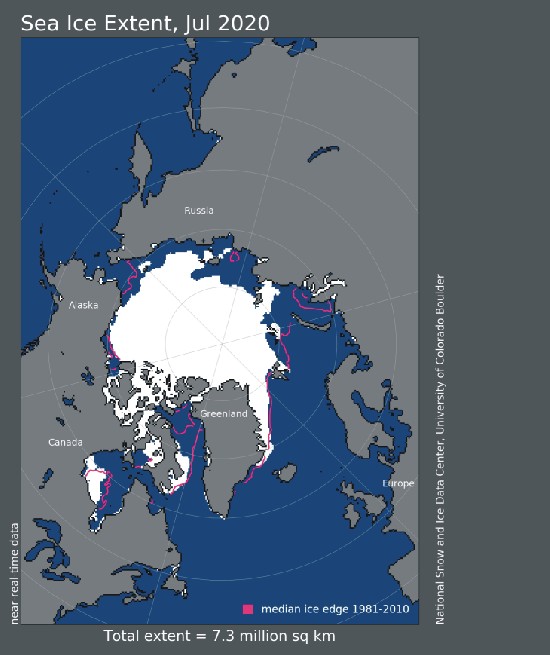
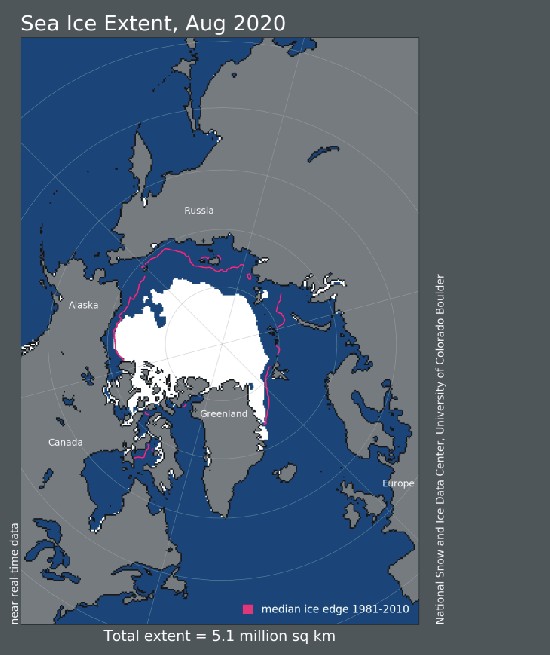
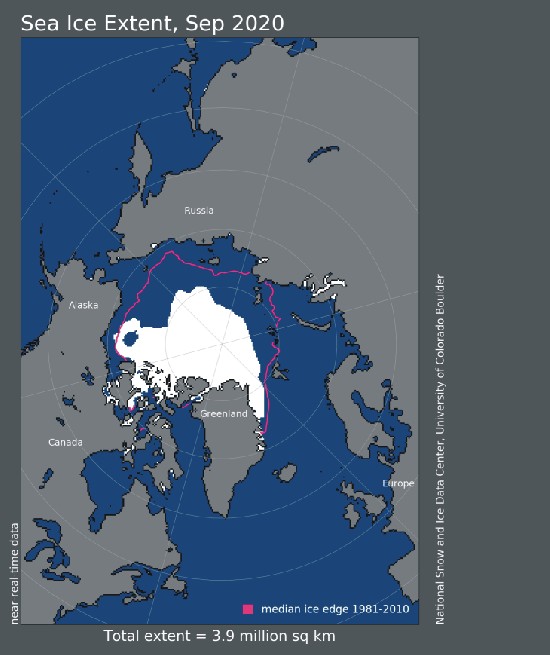
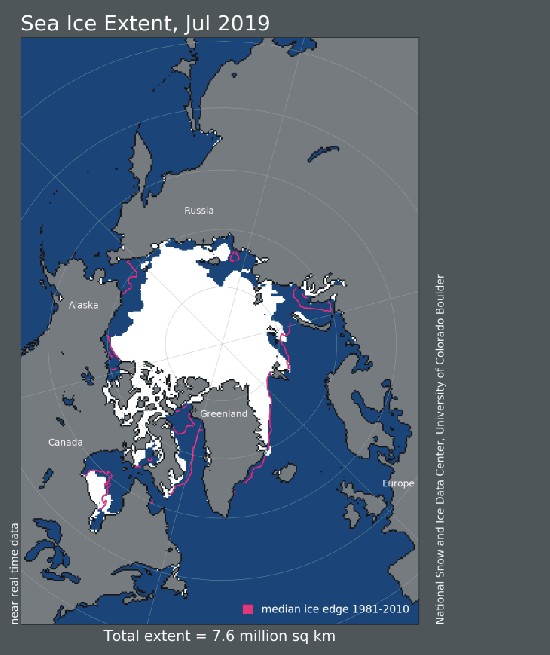
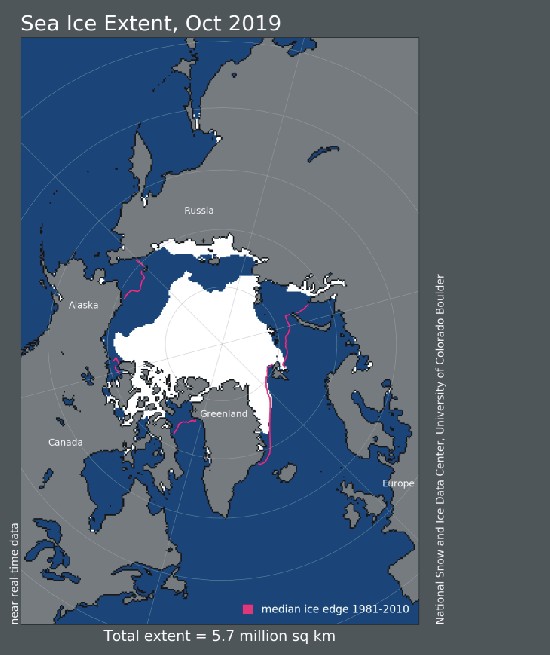
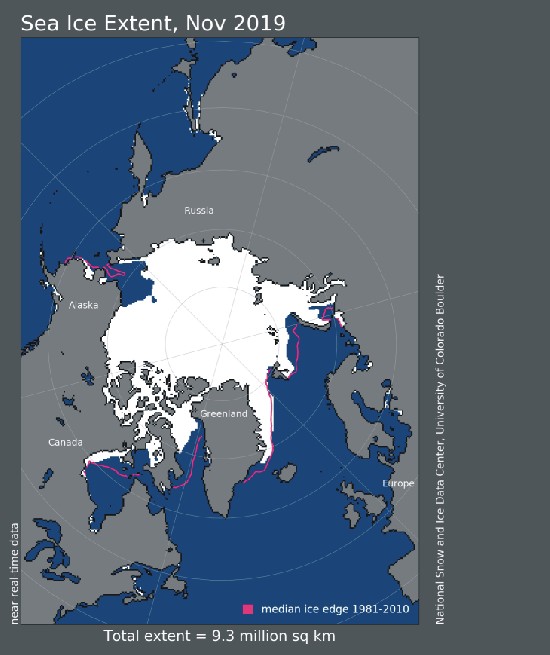
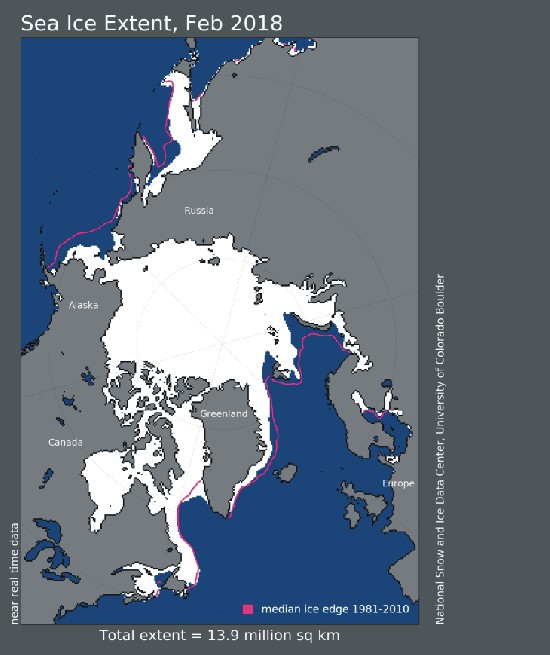
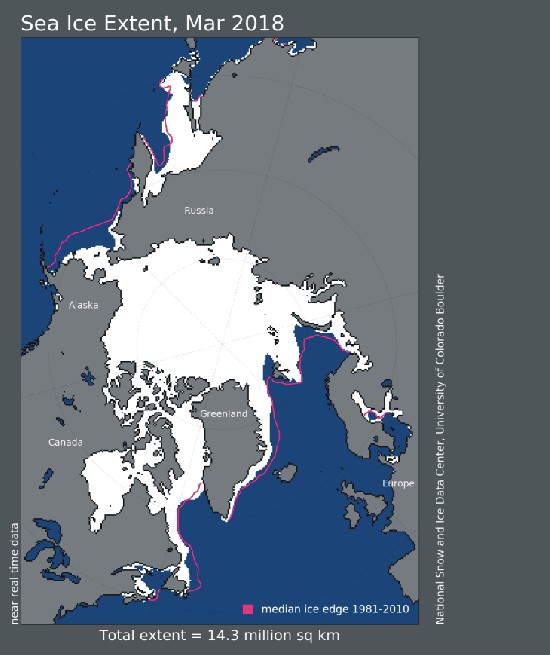
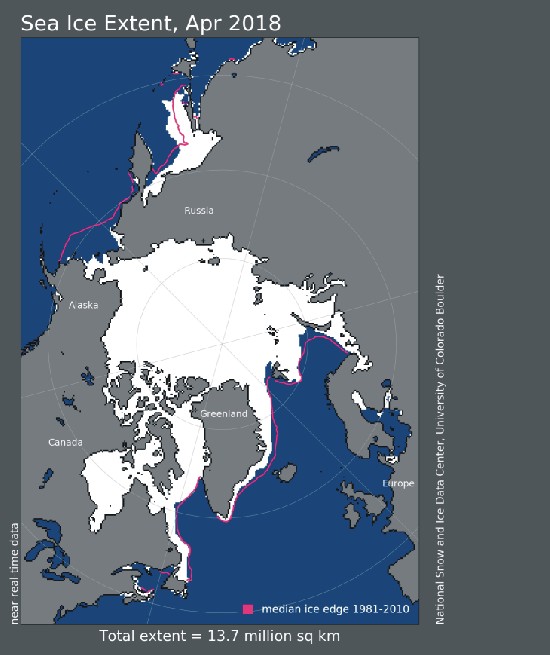
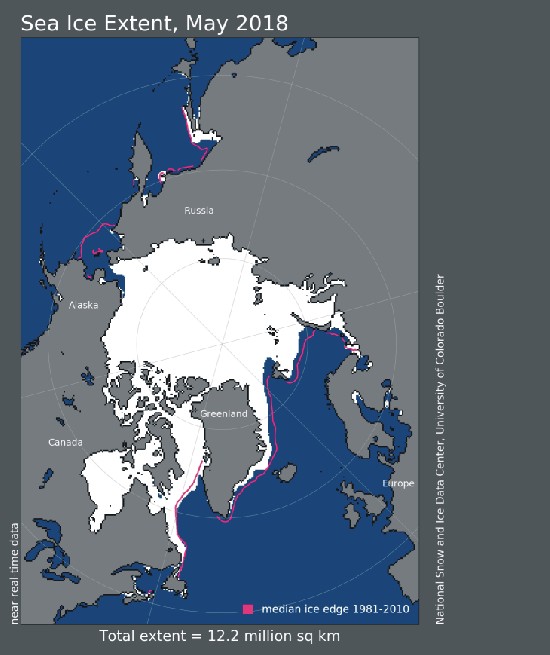
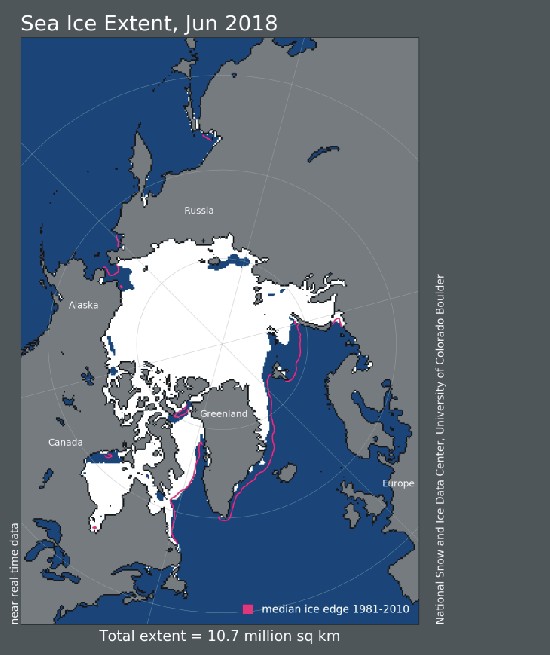
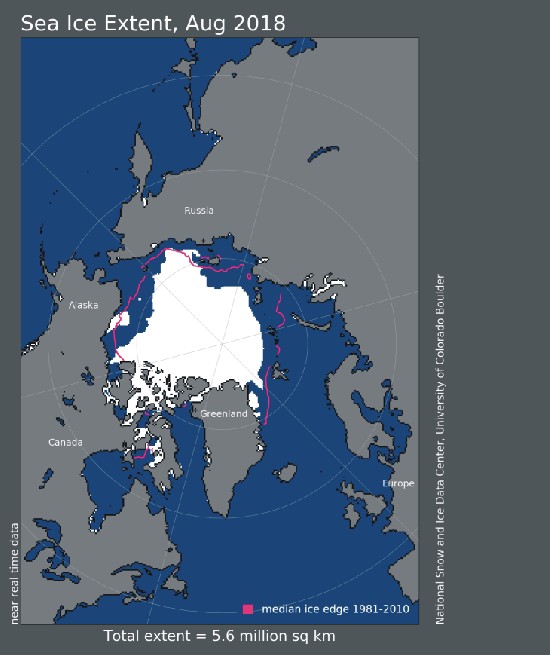
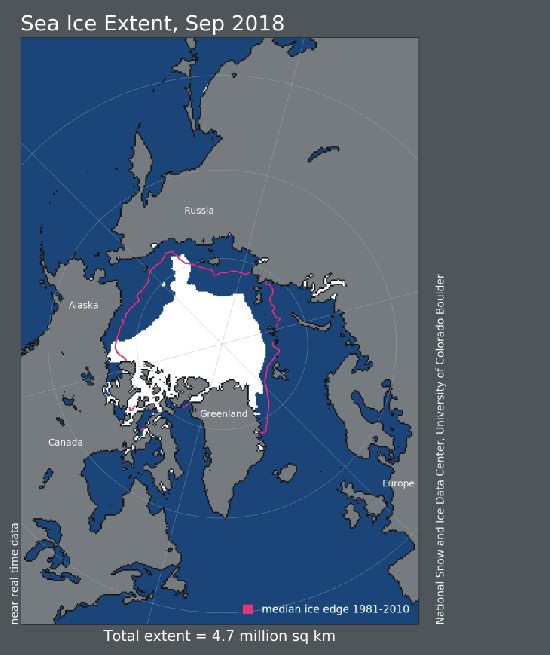
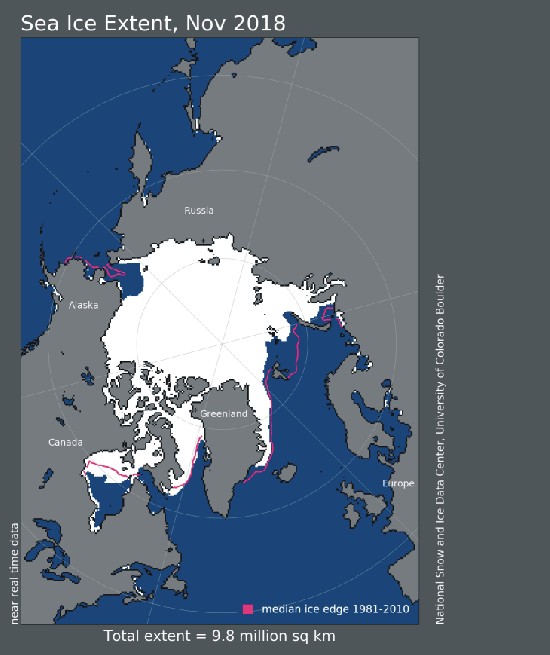
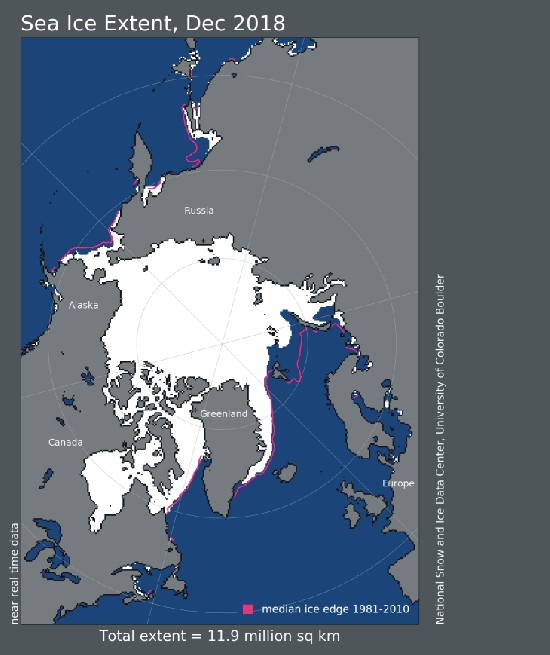
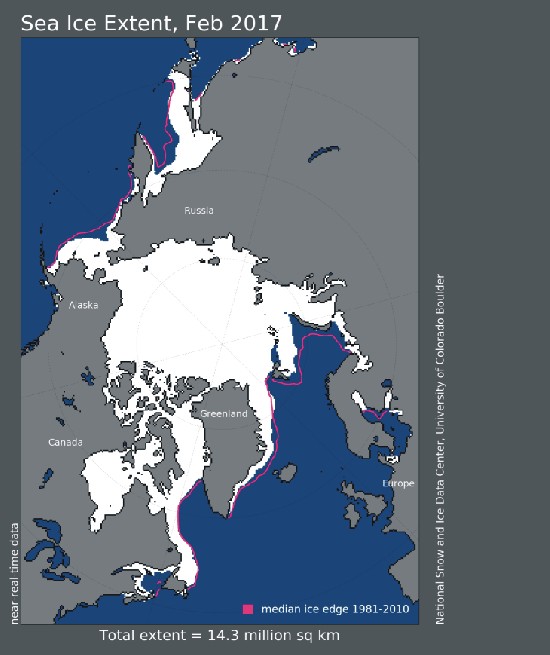
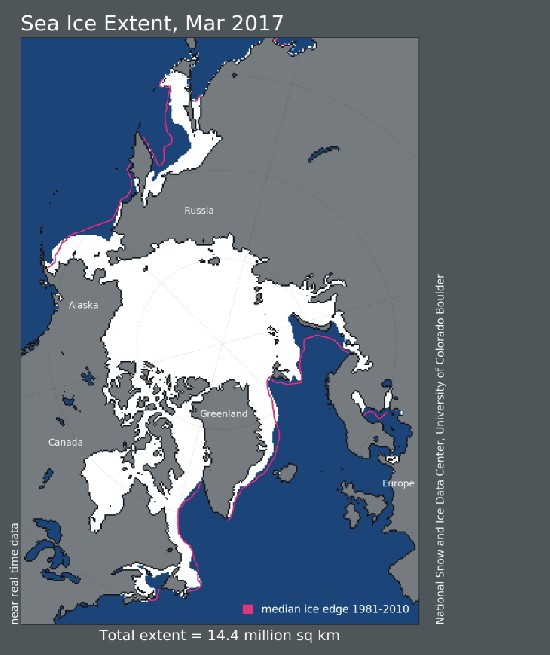
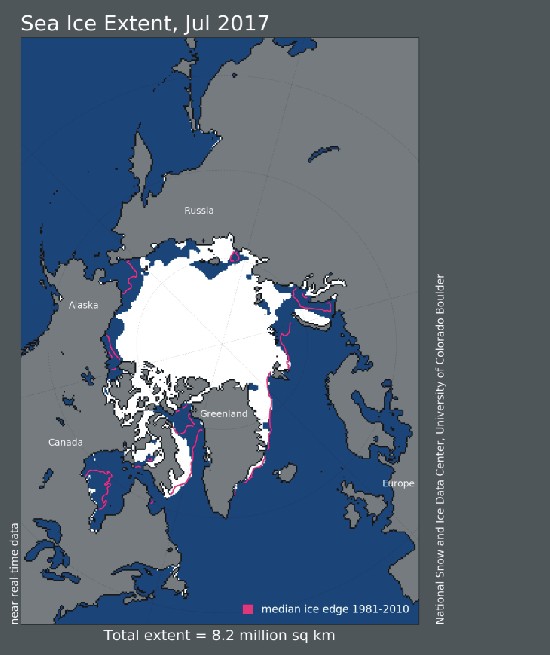
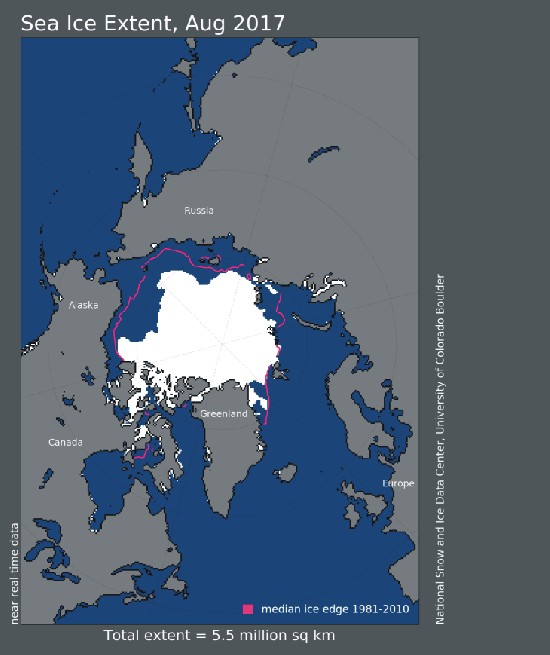
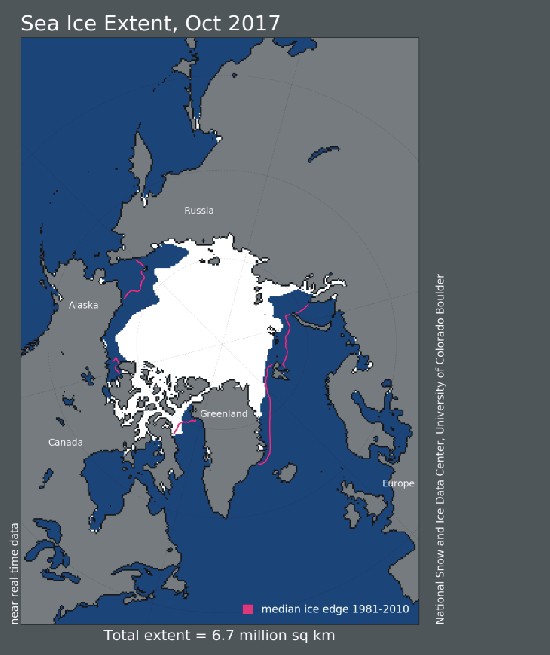
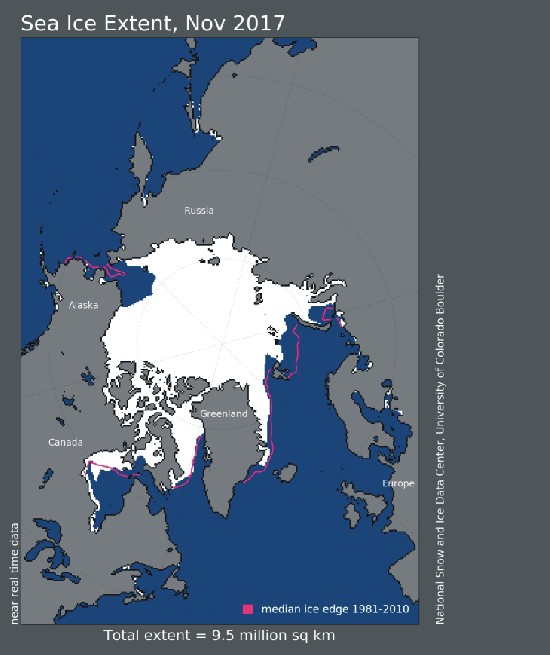
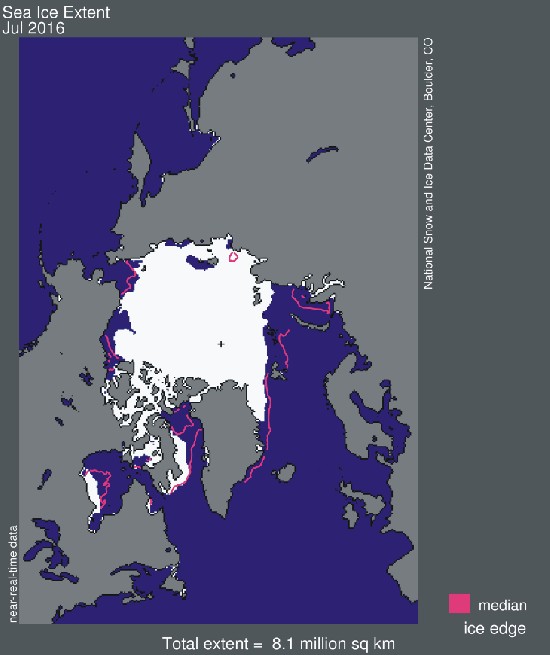
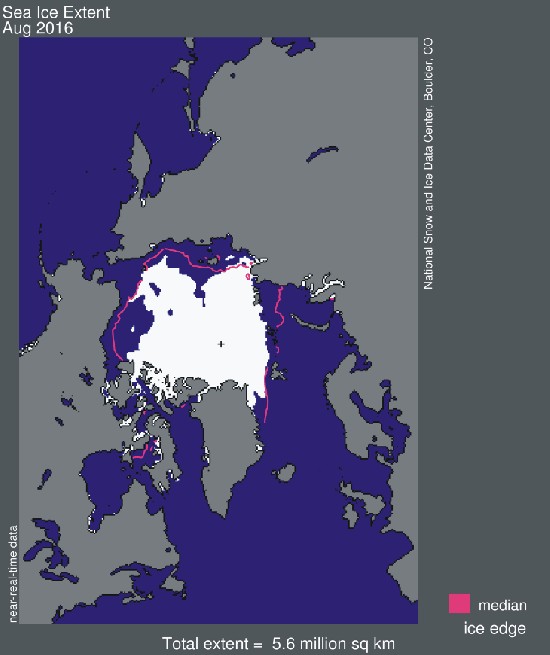
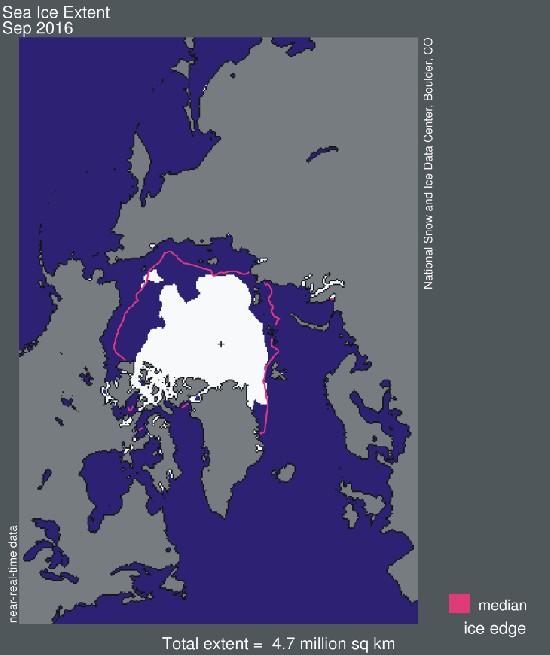
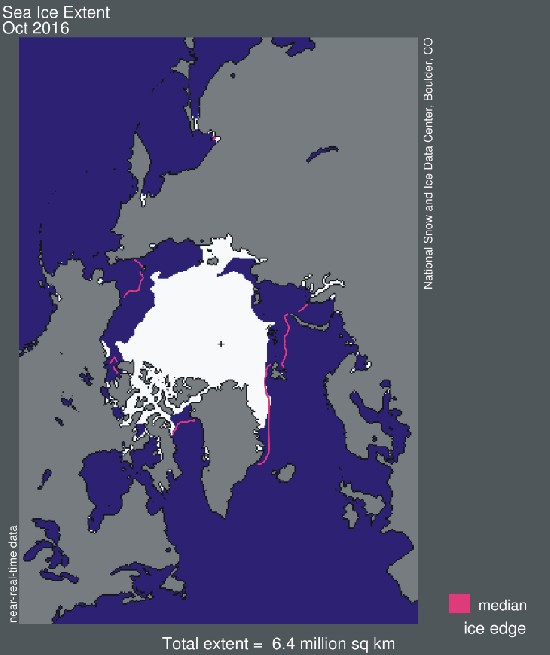
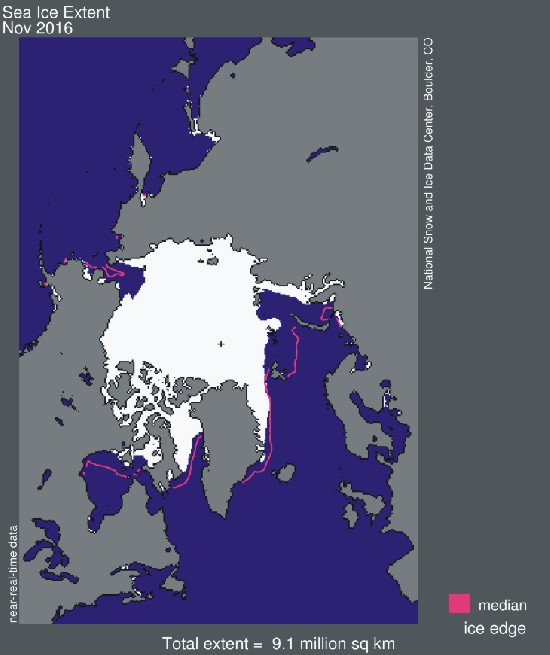
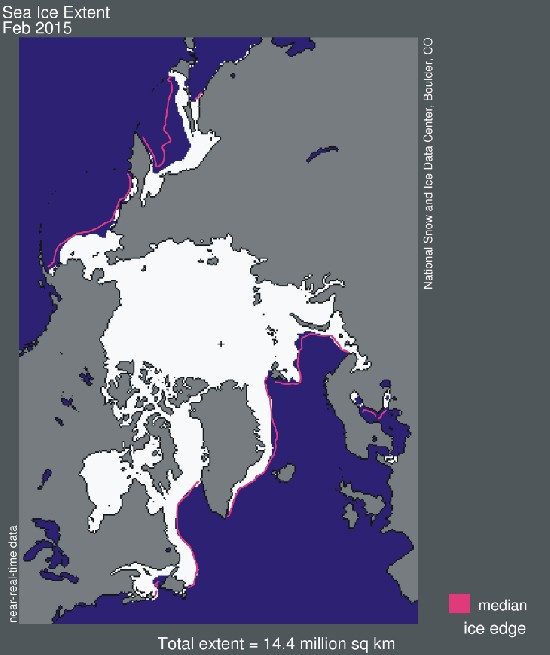
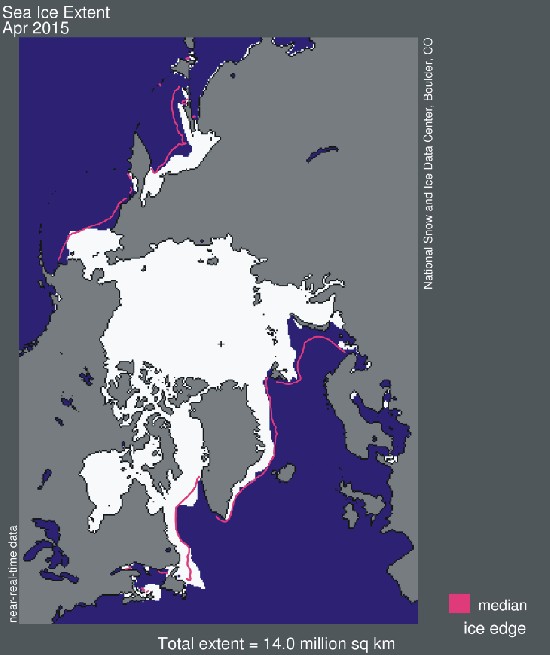
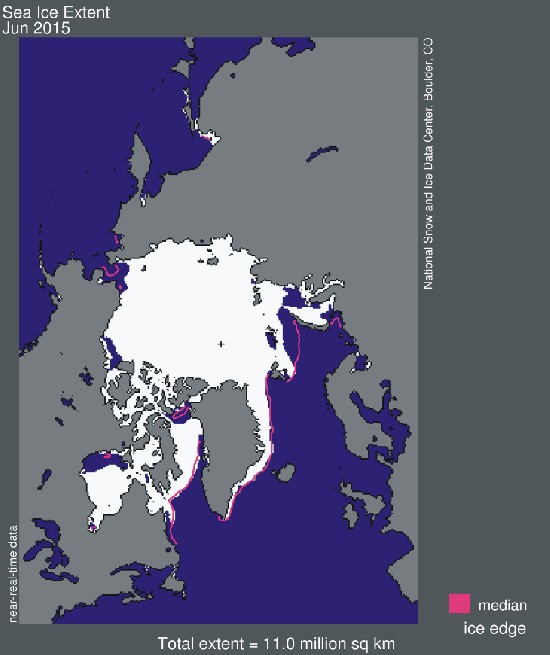
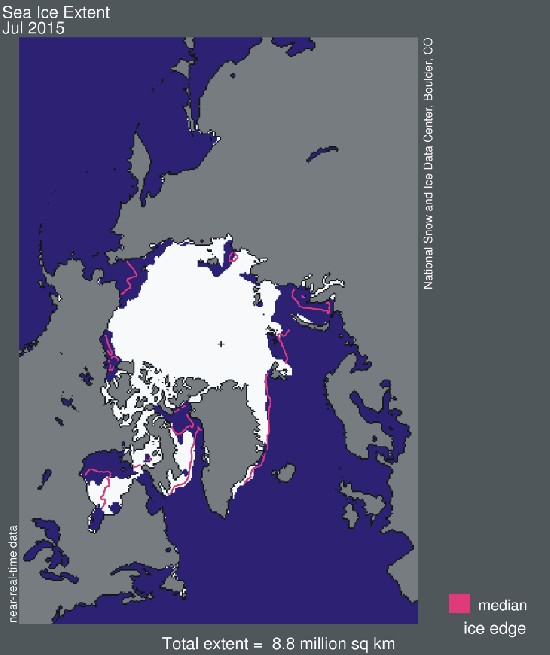
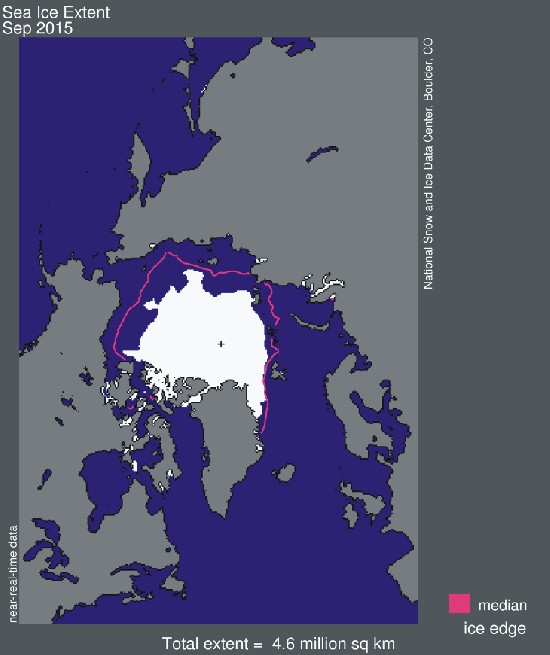
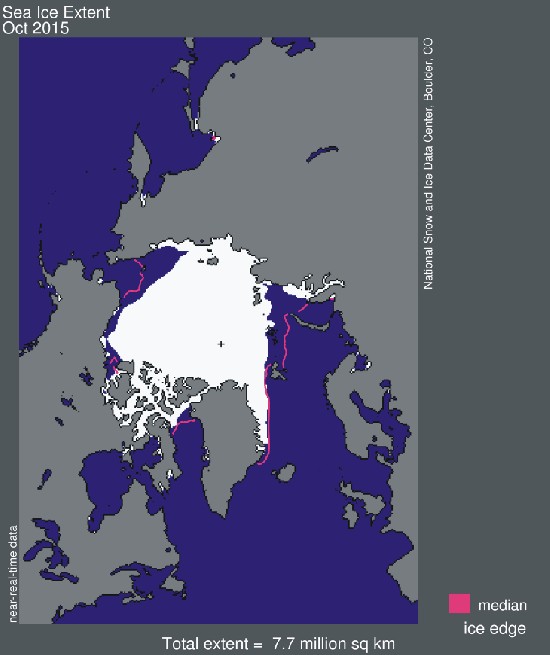
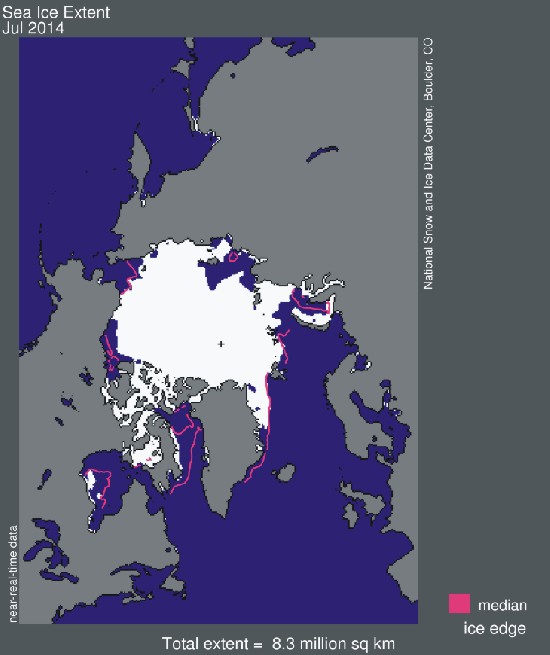
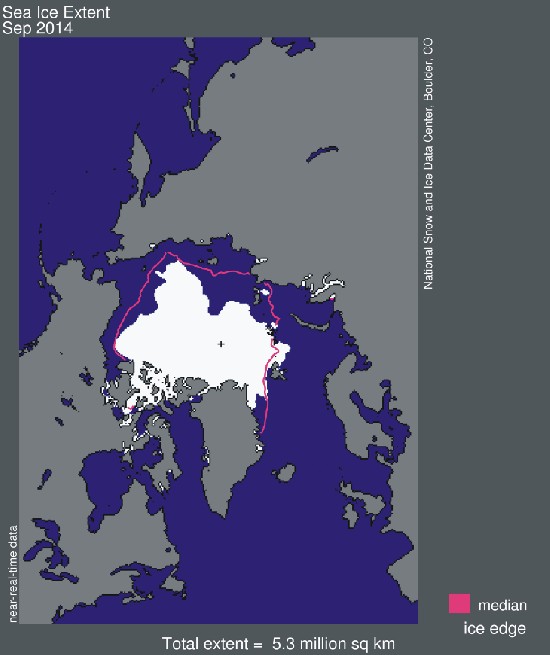
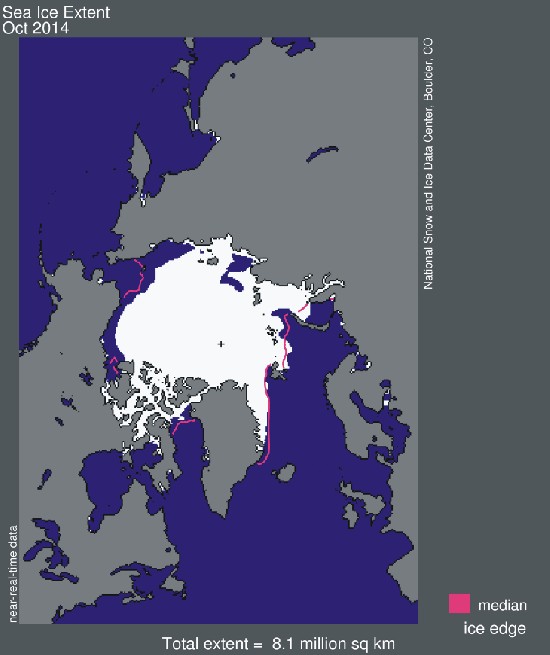
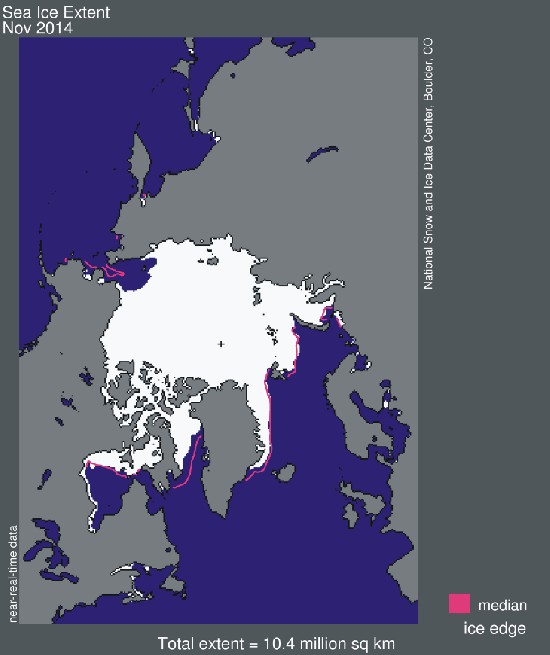
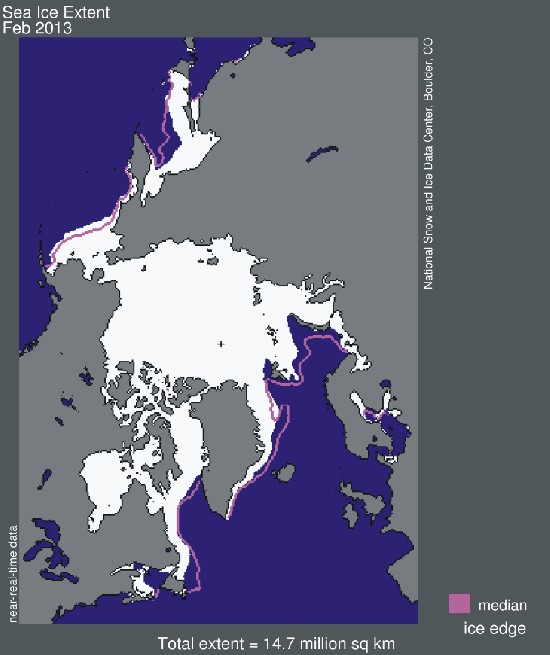
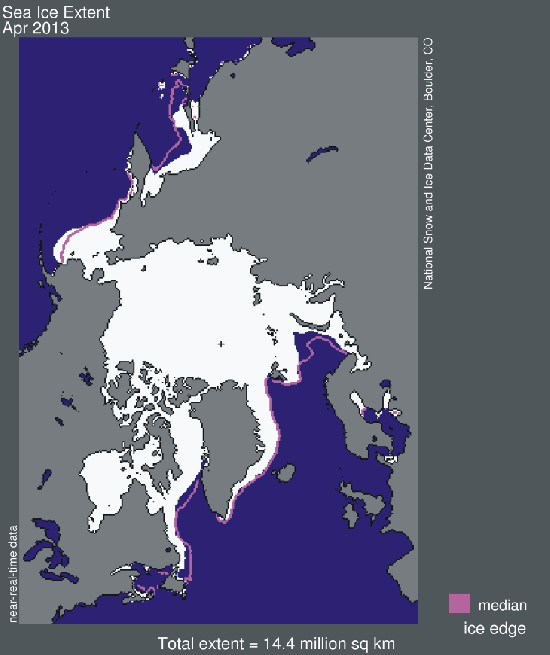
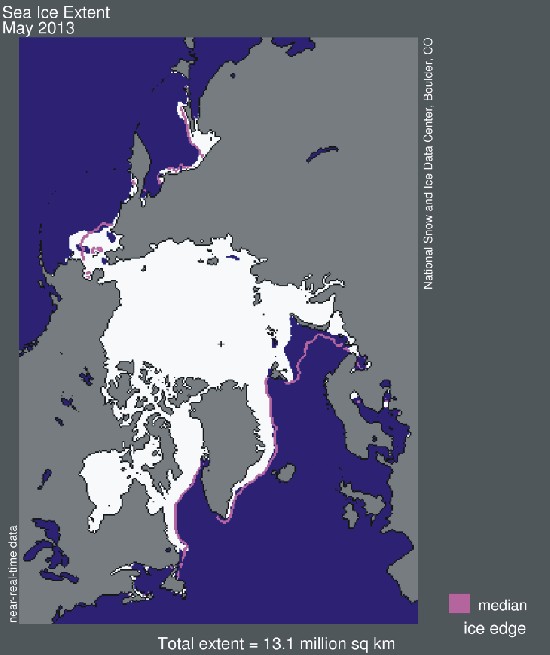
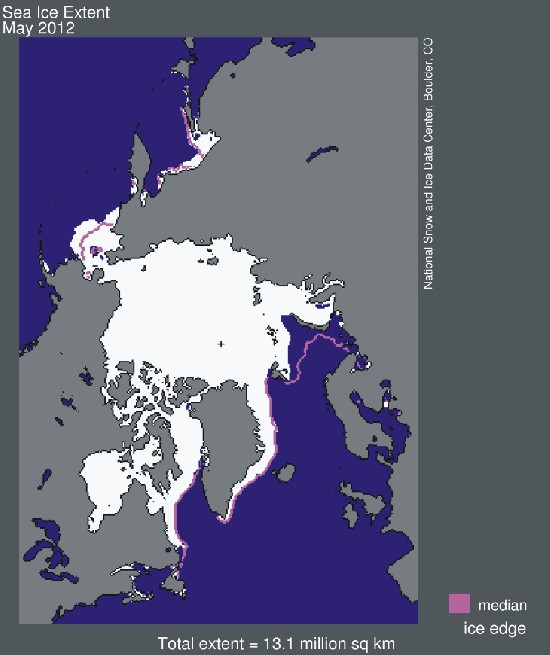
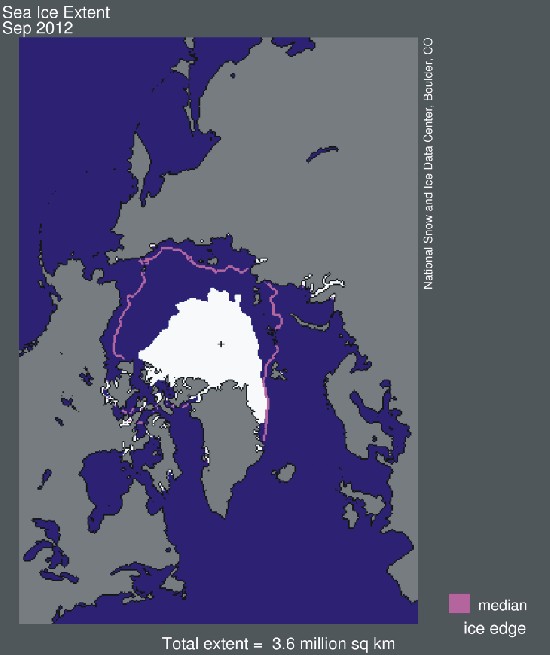
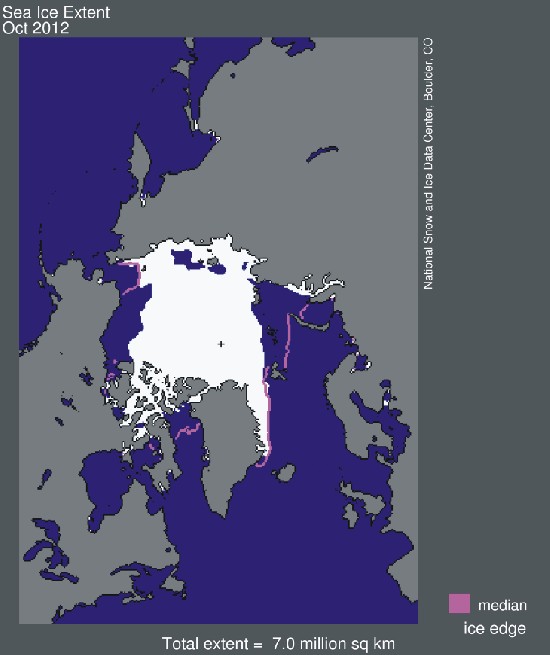
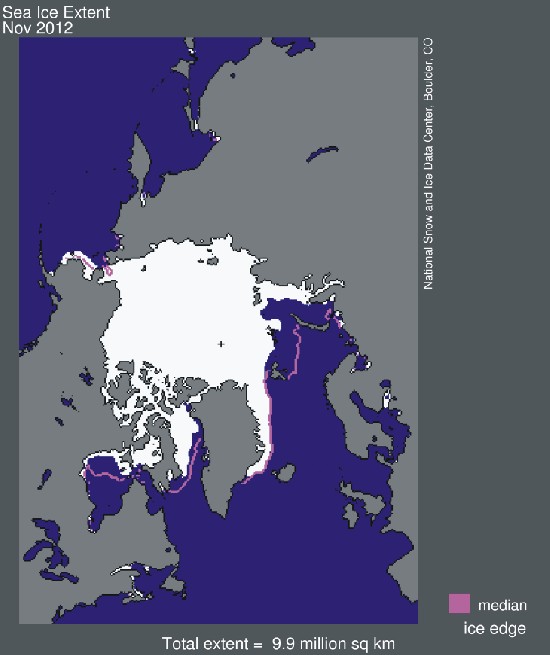
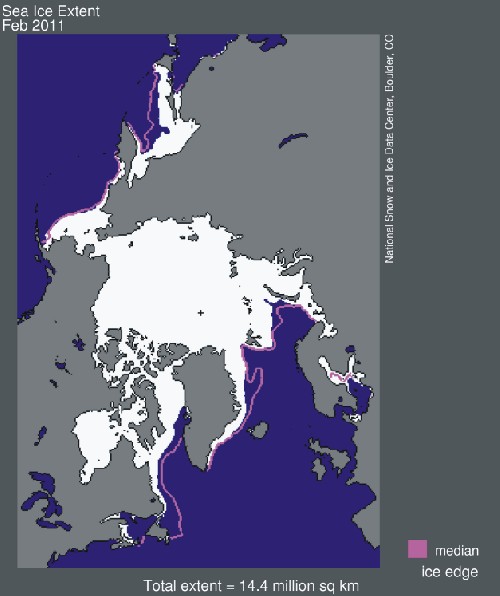
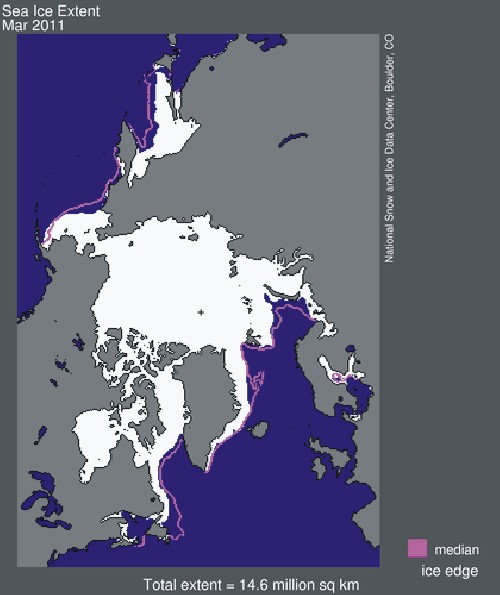
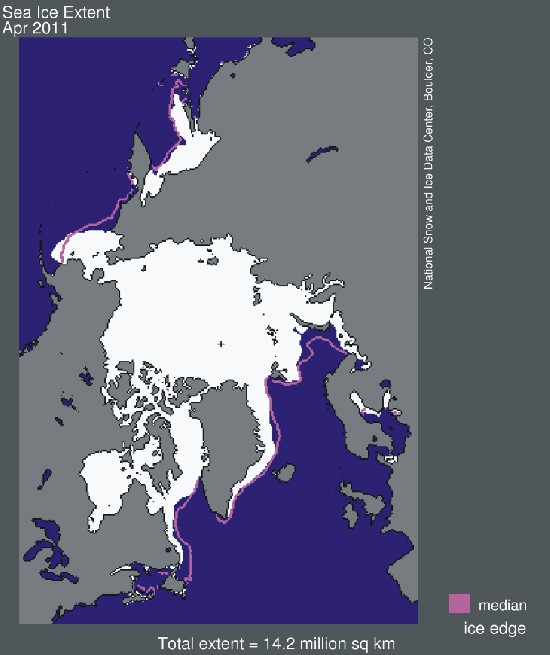
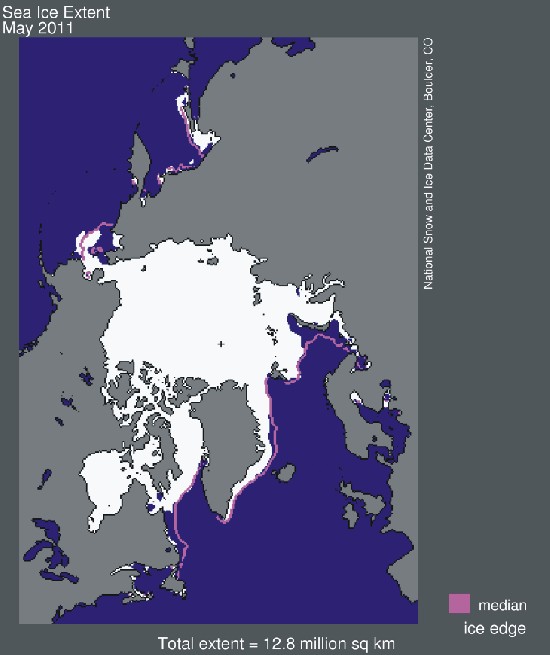
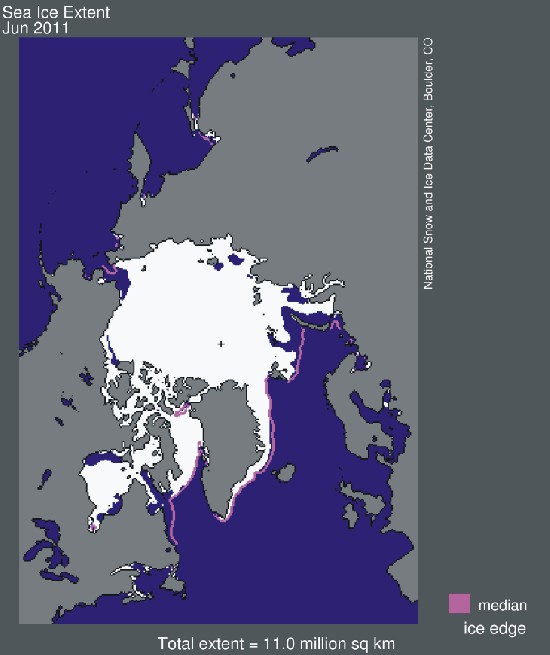
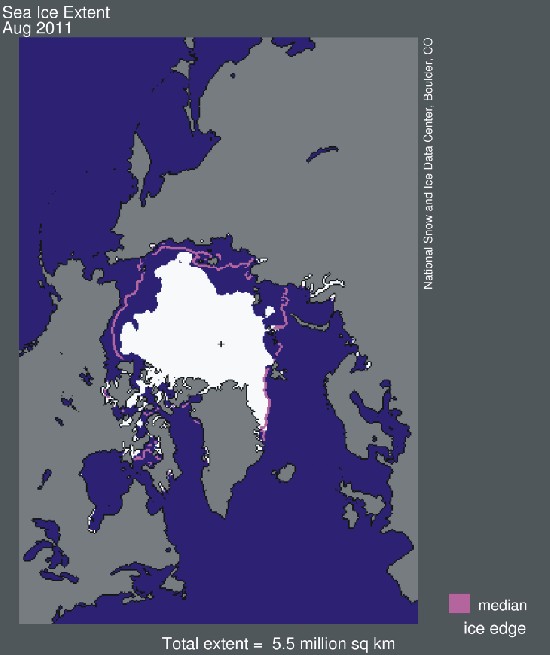
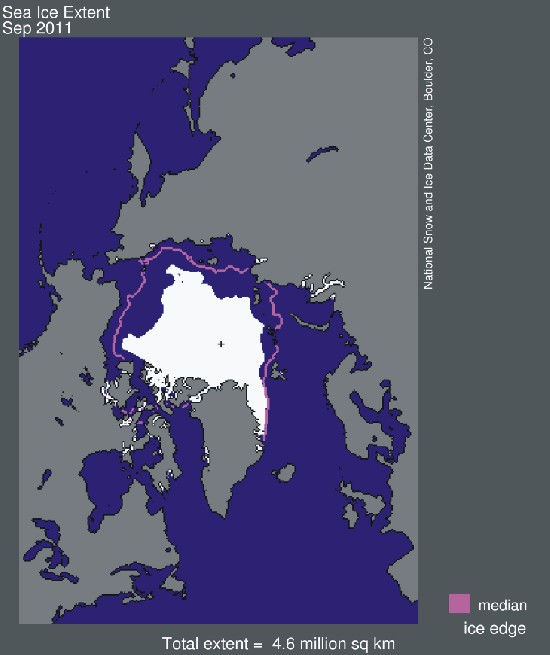
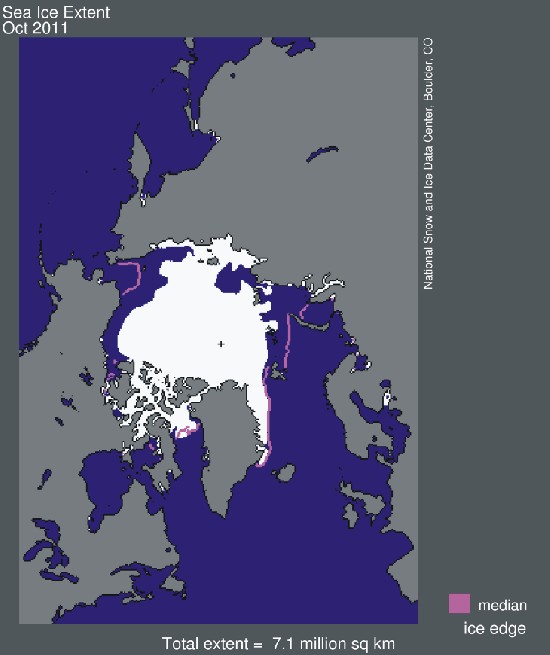
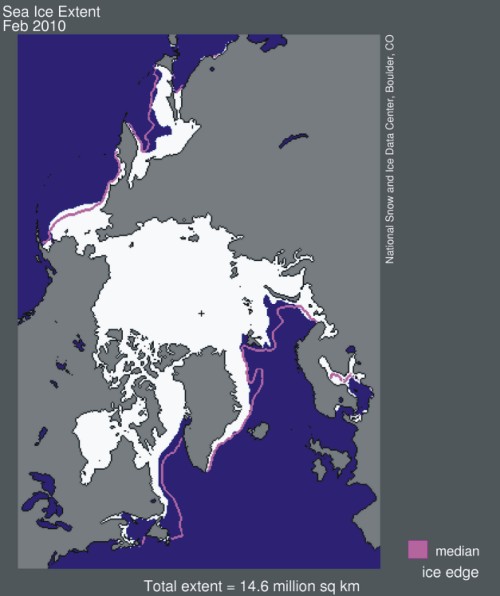
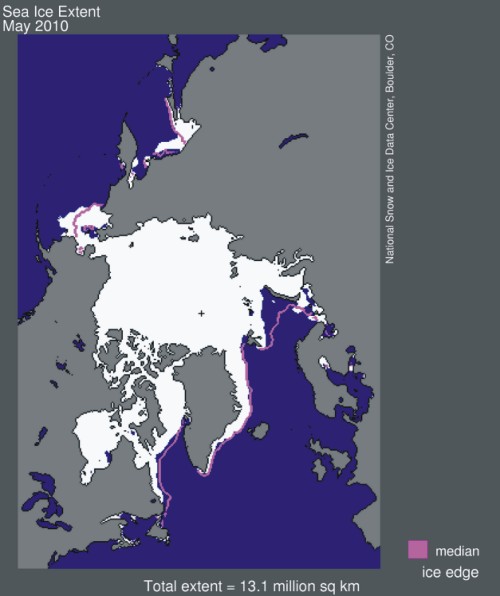
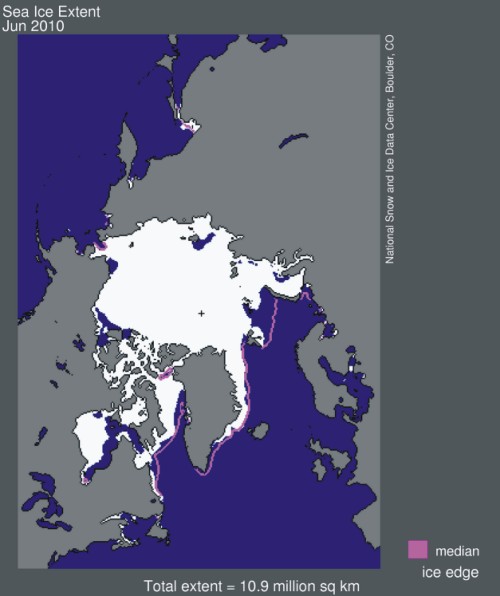
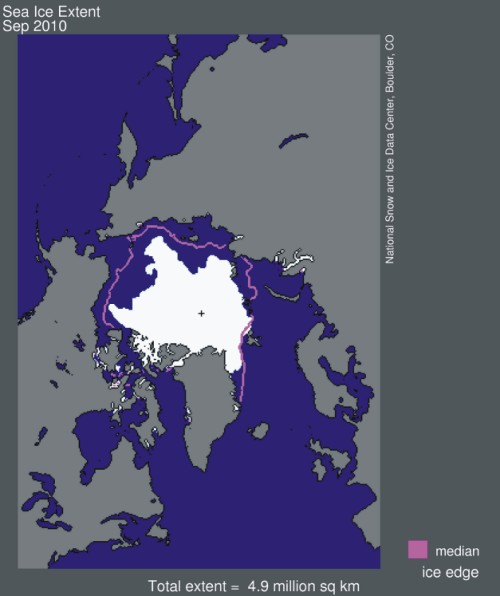
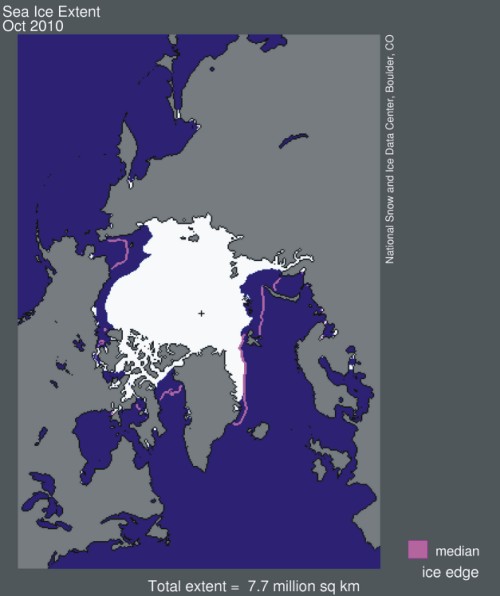
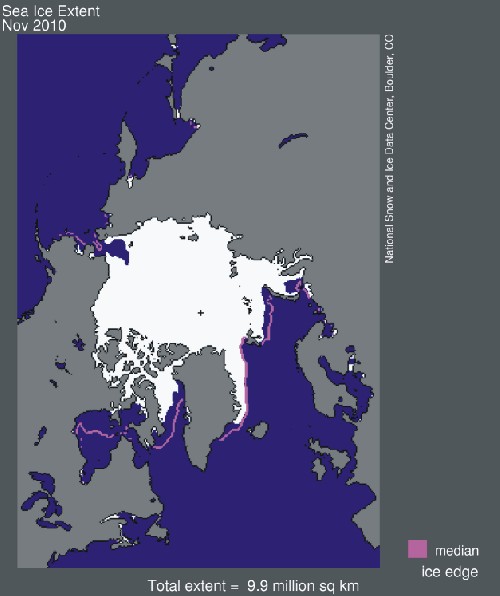
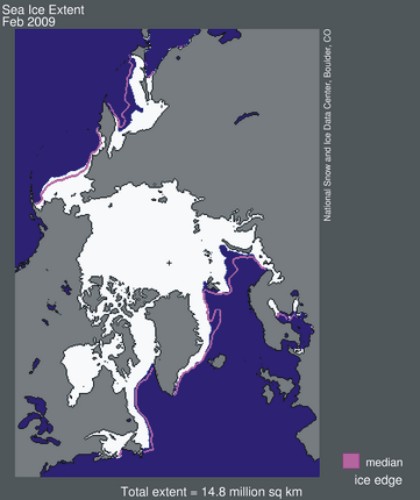
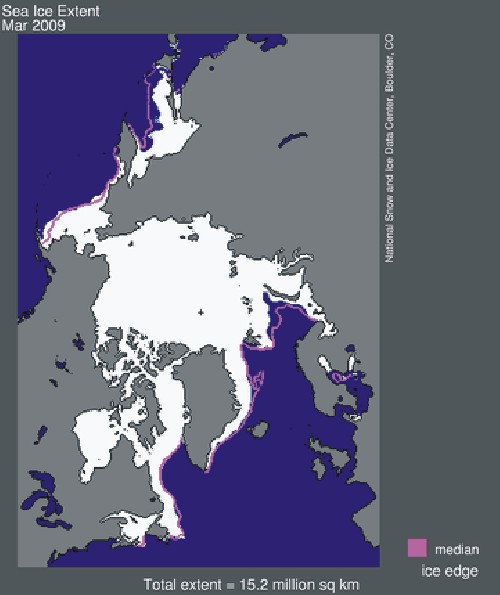
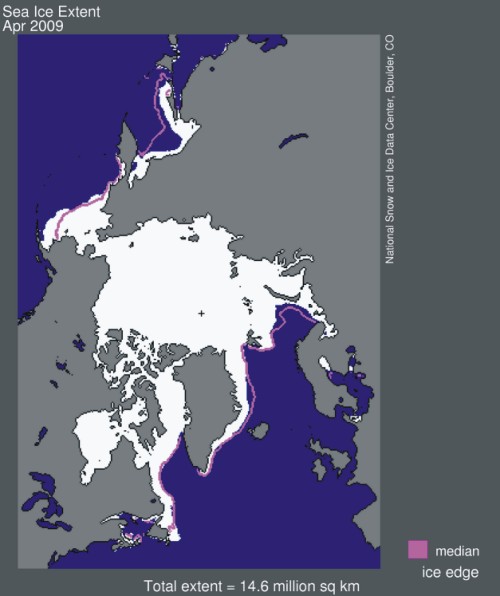
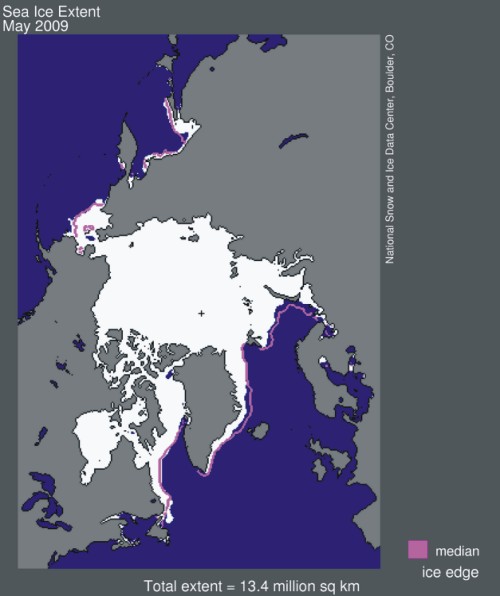
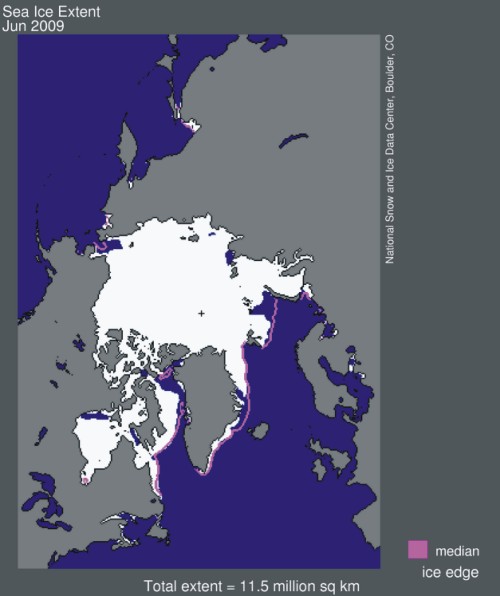
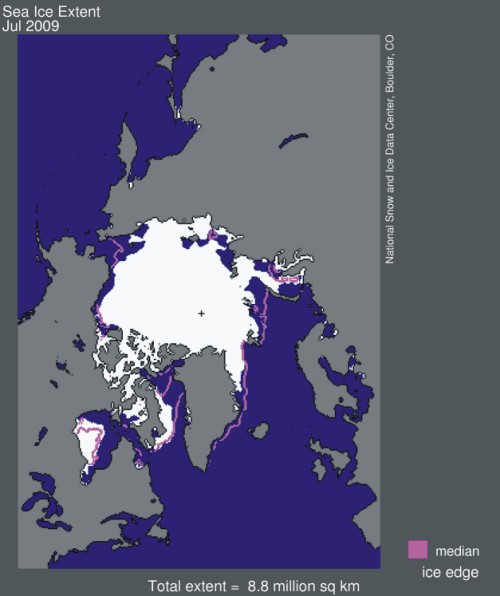
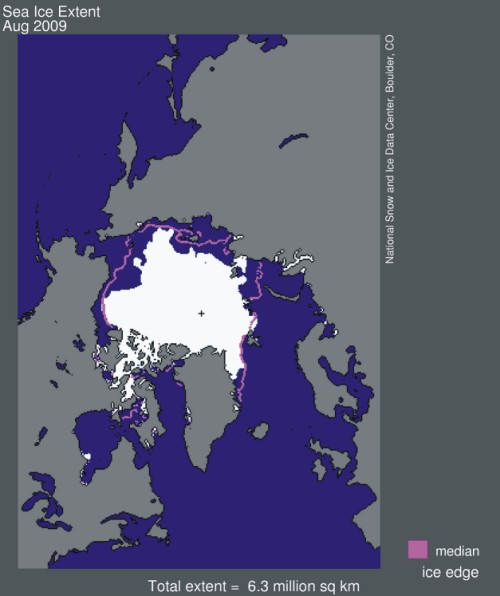
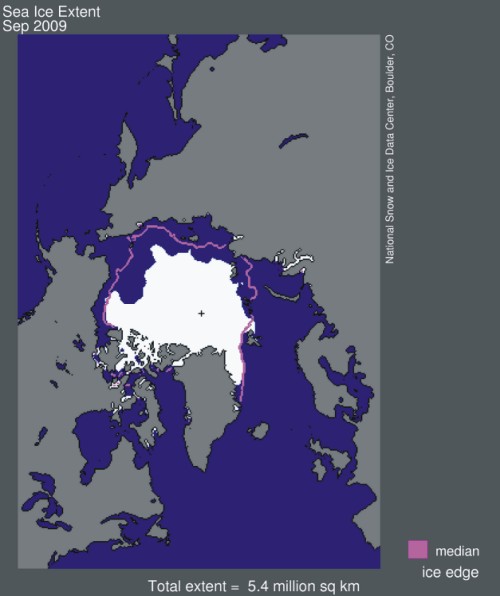
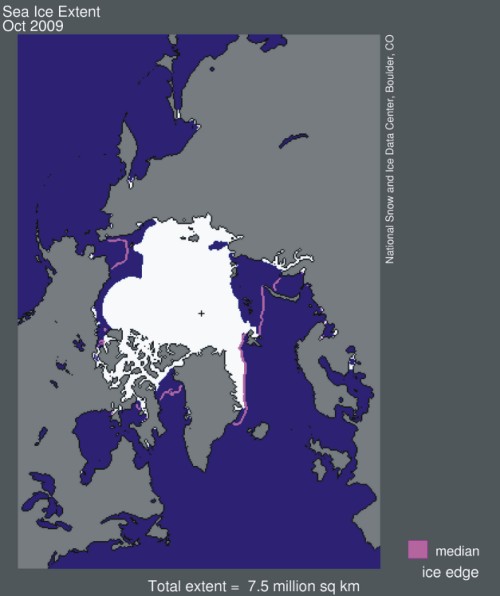
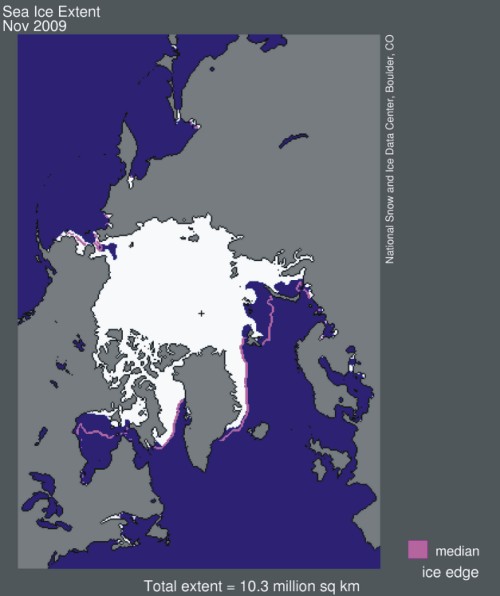
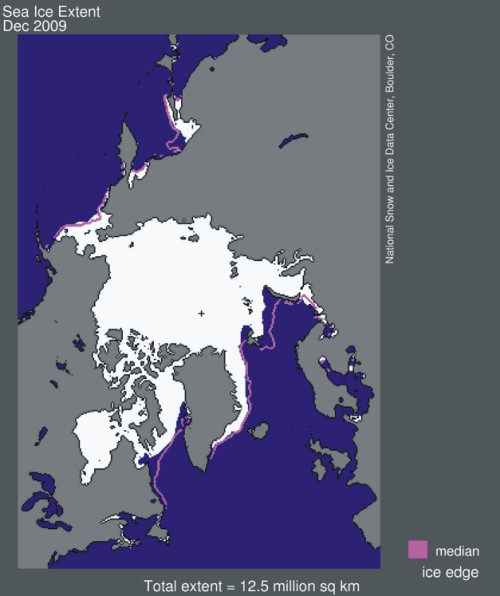
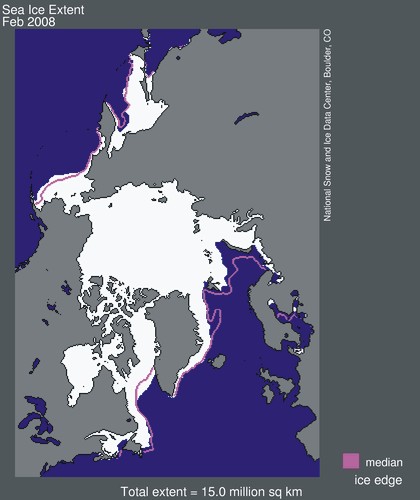
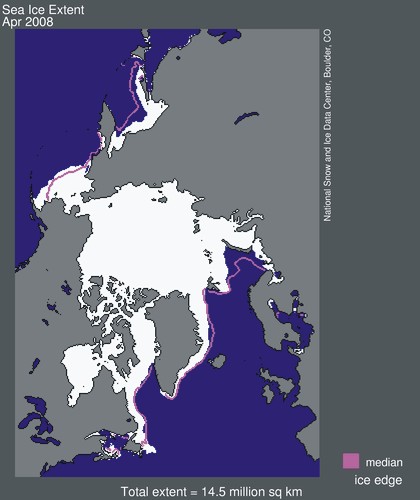
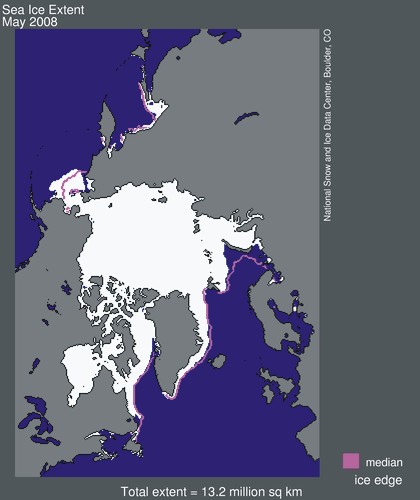
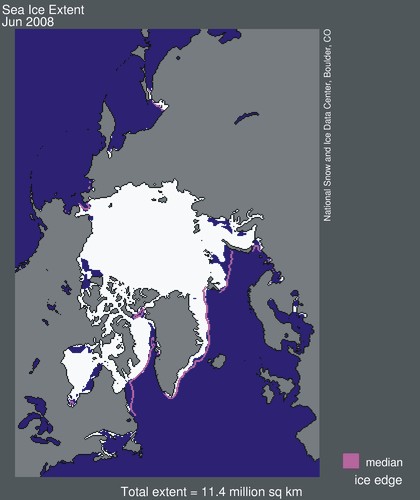
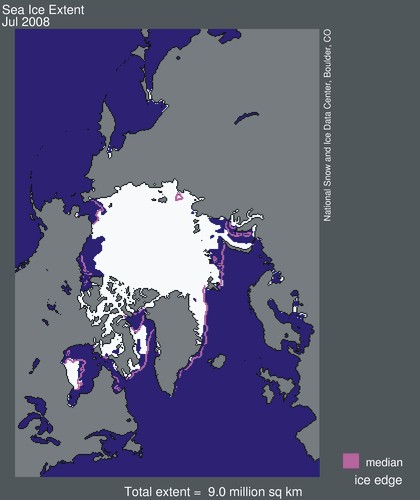
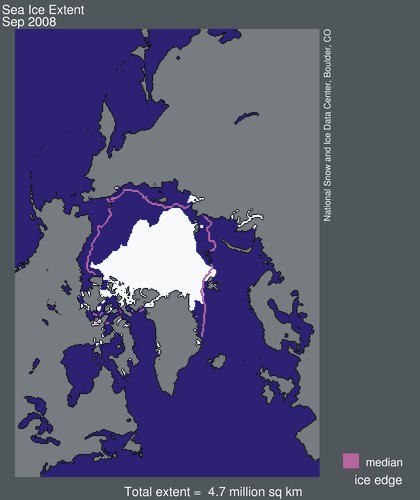
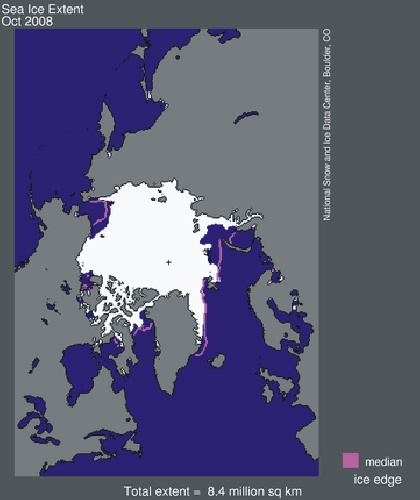
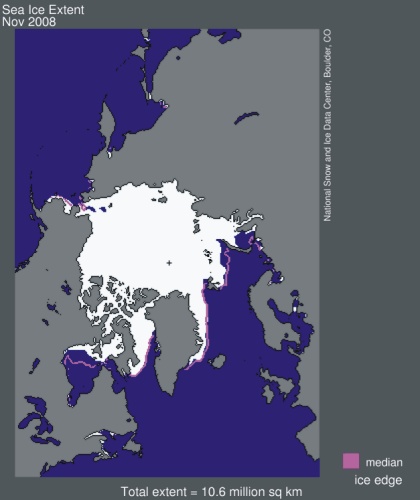
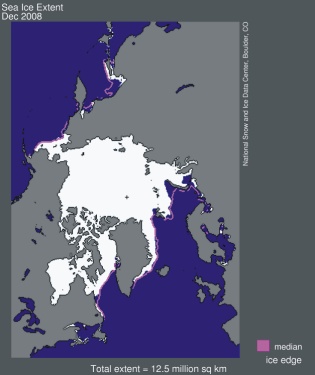
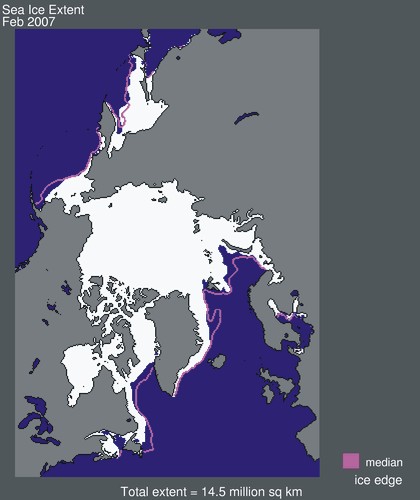
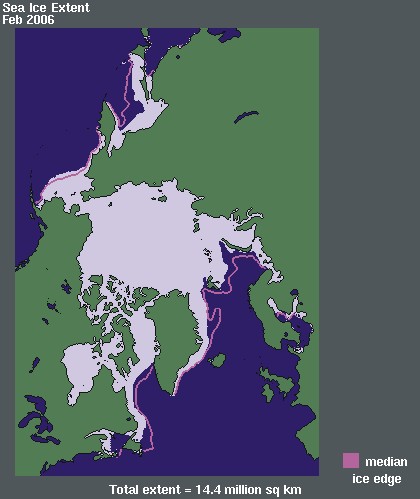
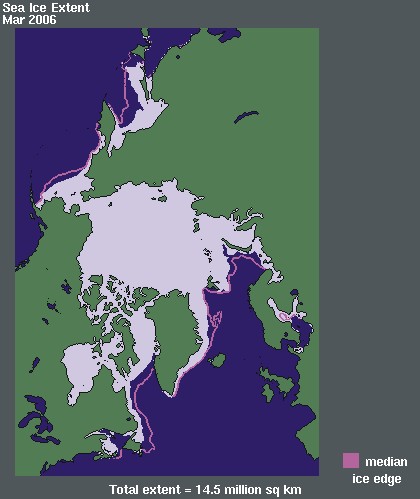
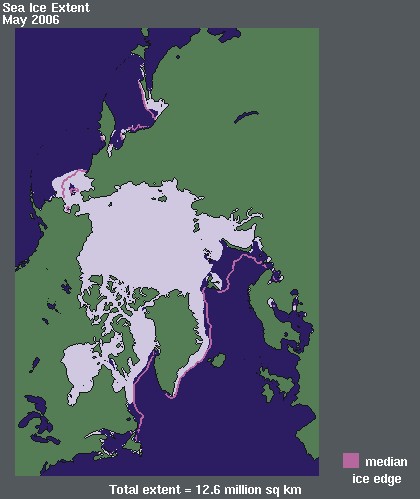
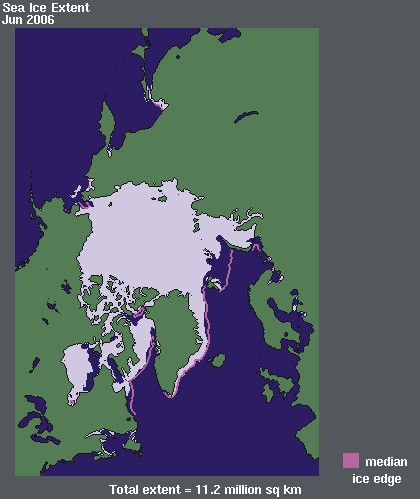
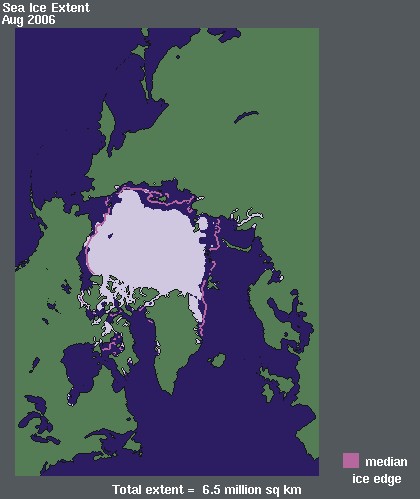
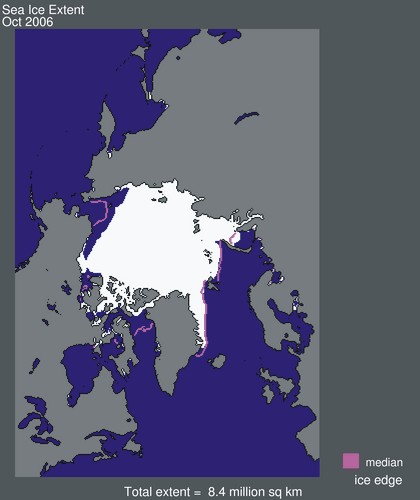
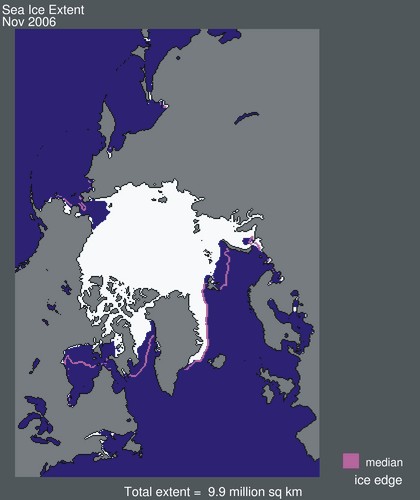
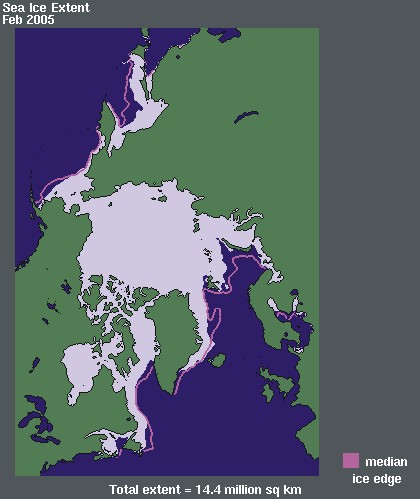
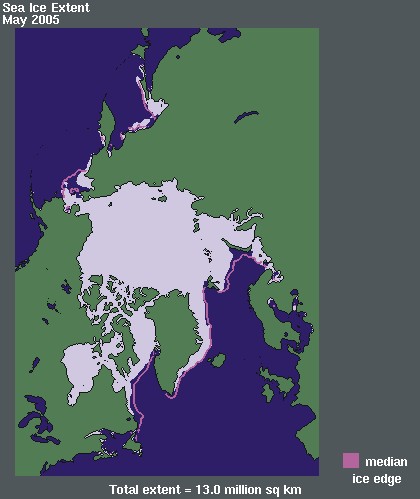
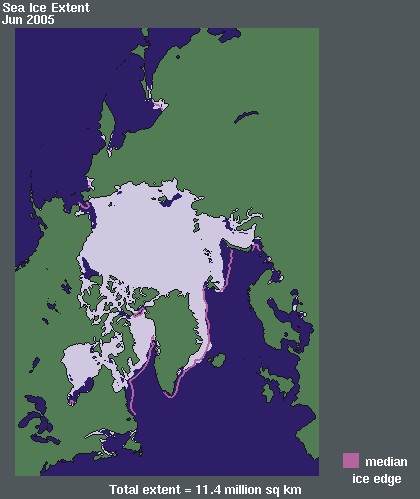
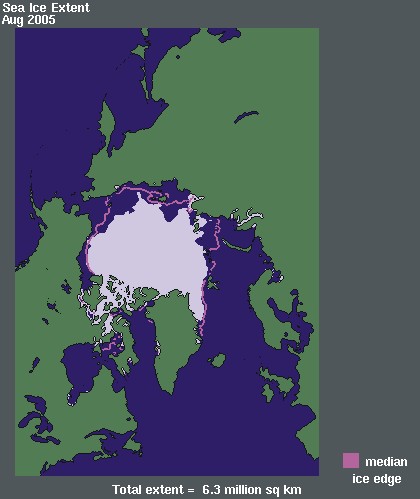
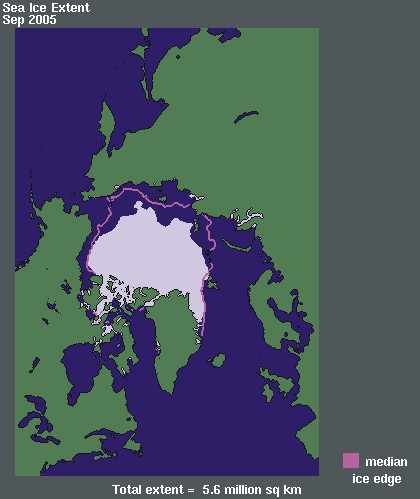
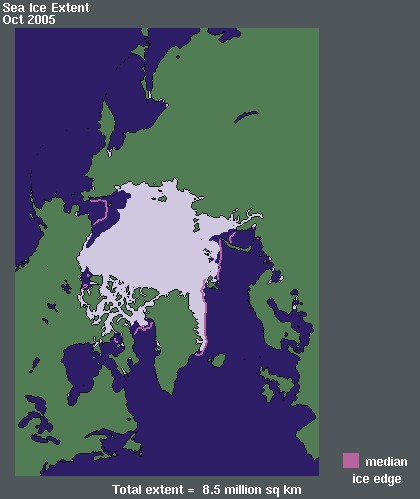
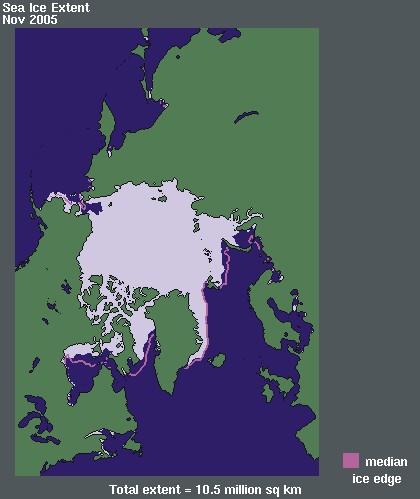
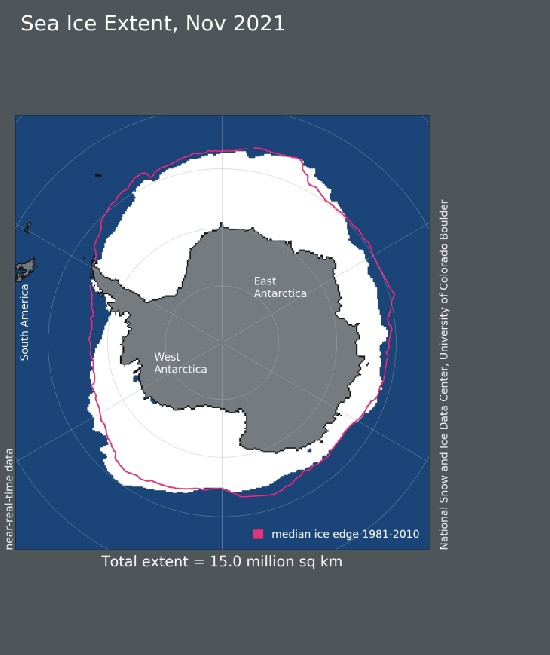
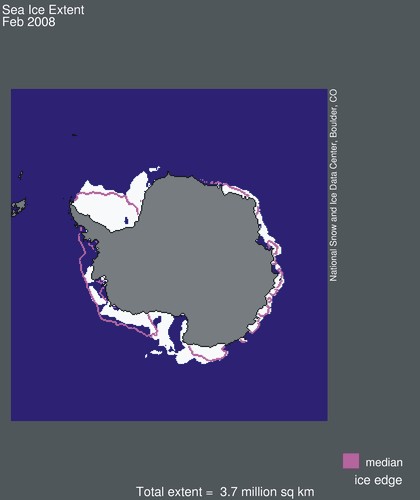
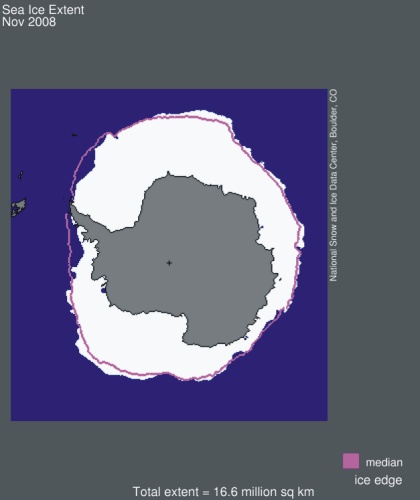
Monthly average sea ice extension in the northern hemisphere since 2005. The limit of sea ice is in this analysis defined as 15% sea ice cover, according to satellite observations. Click on the small maps to open larger sea ice map. The orange line in the large maps indicates the average monthly extension of sea ice since November 1978, according to satellite observations. Map source: National Snow and Ice Data Center (NSIDC). Please use this link if you want to see the original figures or want to check for more recent updates than shown above. A detailed analysis is also available at this site. Latest figure update: 9 April 2024.
Click here to jump back to the list of contents.
Southern hemisphere monthly sea ice map table
| YEAR | JAN | FEB | MAR | APR | MAY | JUN | JUL | AUG | SEP | OCT | NOV | DEC |
| 2024 |  |
 |
 |
|||||||||
| 2023 | 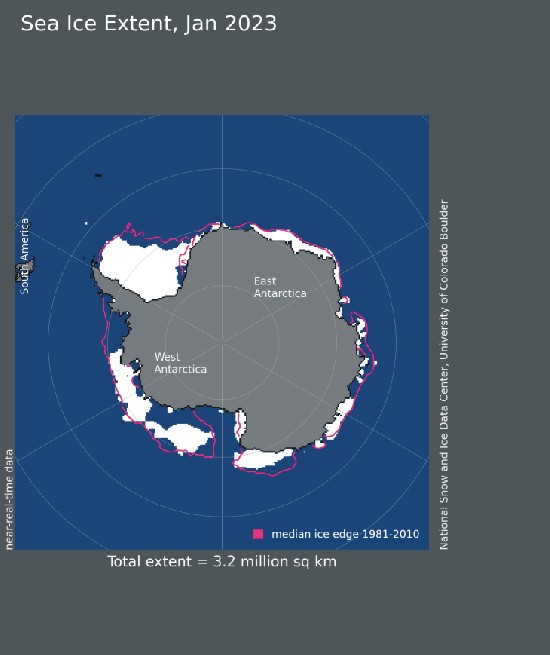 |
 |
 |
 |
 |
 |
 |
 |
 |
 |
 |
 |
| 2022 | 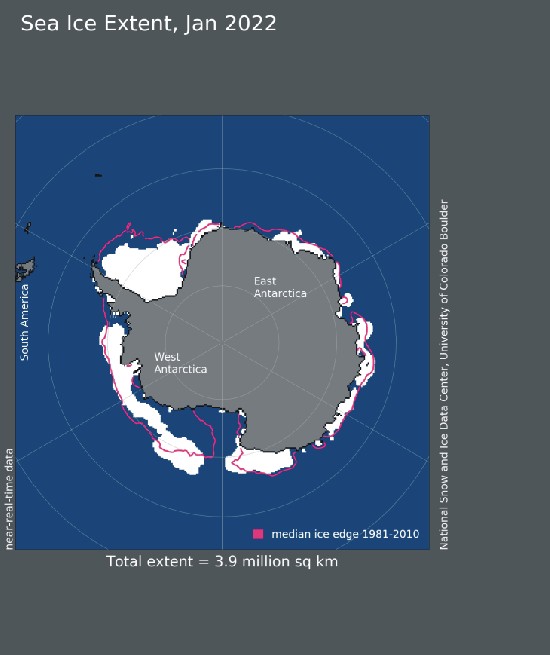 |
 |
 |
 |
 |
 |
 |
 |
 |
 |
 |
 |
| 2021 | 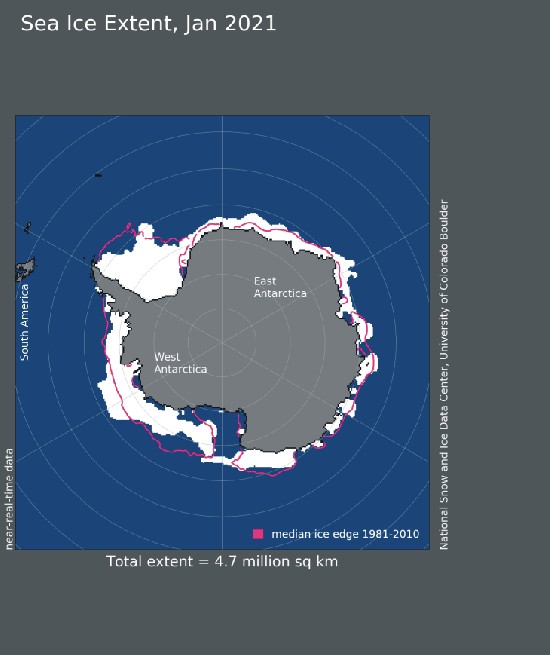 |
 |
 |
 |
 |
 |
 |
 |
 |
 |
 |
 |
| 2020 | 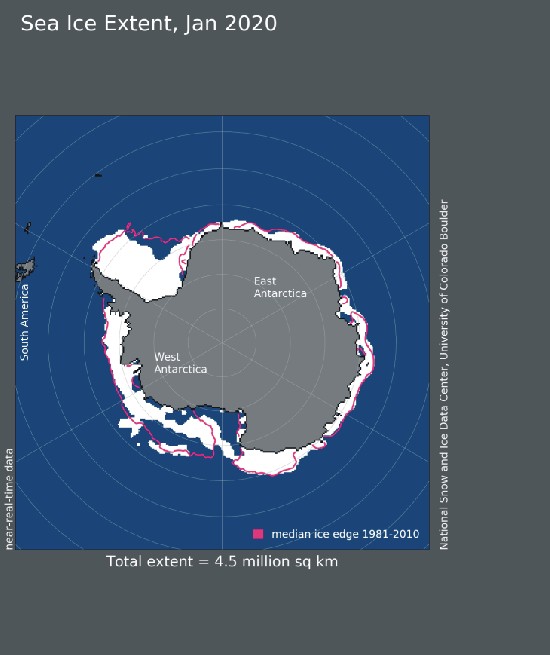 |
 |
 |
 |
 |
 |
 |
 |
 |
 |
 |
 |
| 2019 | 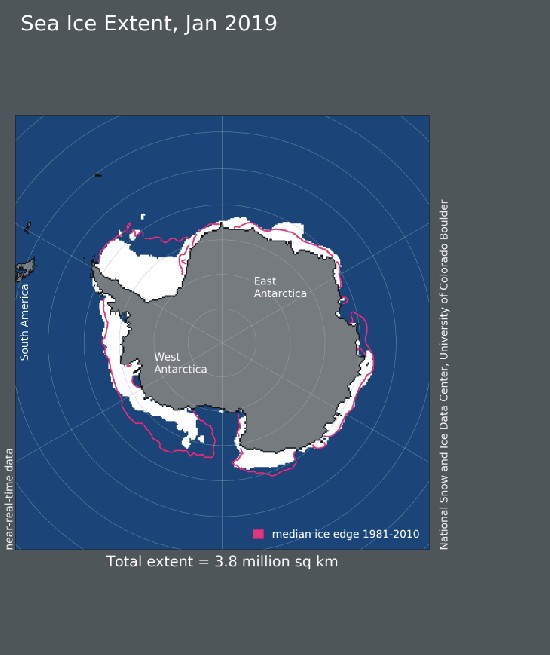 |
 |
 |
 |
 |
 |
 |
 |
 |
 |
 |
 |
| 2018 |  |
 |
 |
 |
 |
 |
 |
 |
 |
 |
 |
 |
| 2017 | 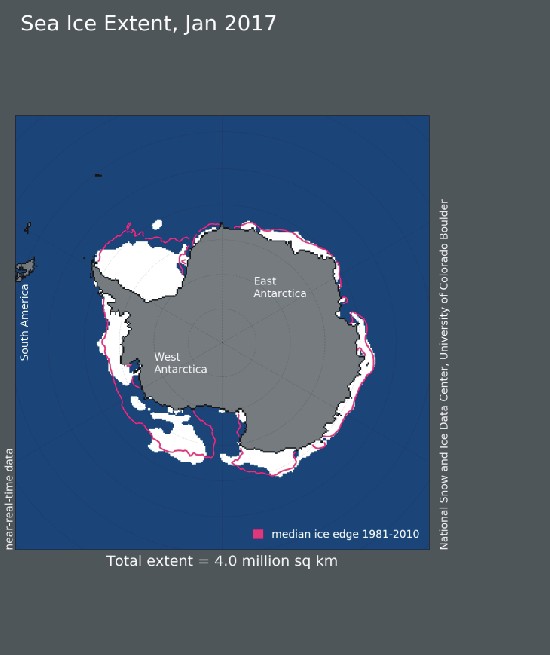 |
 |
 |
 |
 |
 |
 |
 |
 |
 |
 |
 |
| 2016 | 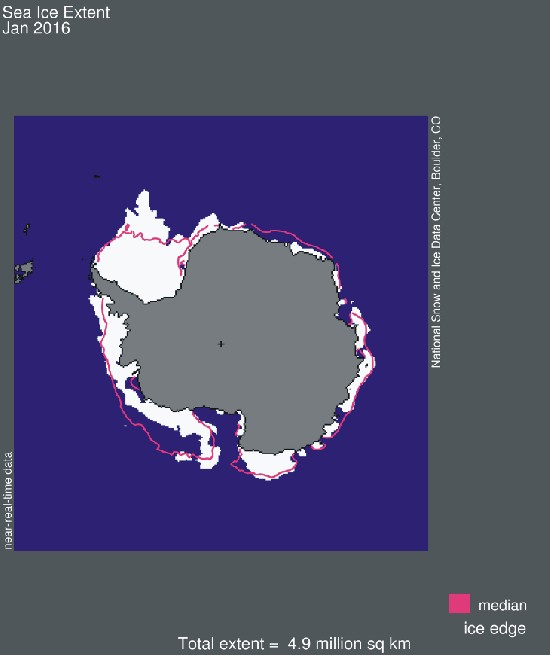 |
 |
 |
 |
 |
 |
 |
 |
 |
 |
 |
 |
| 2015 | 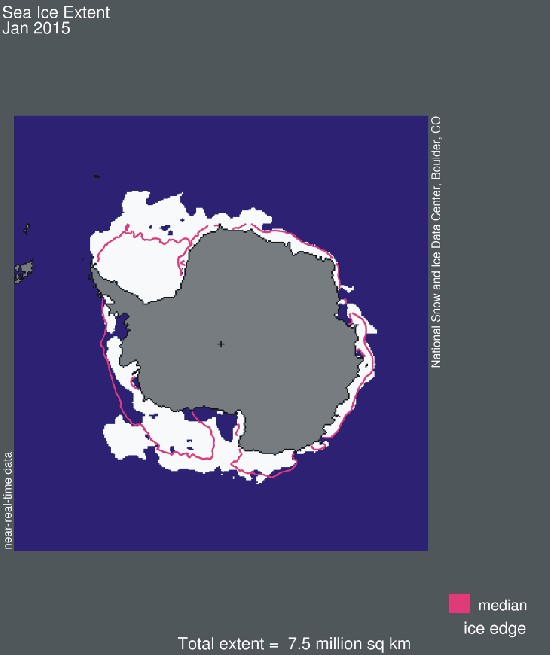 |
 |
 |
 |
 |
 |
 |
 |
 |
 |
 |
 |
| 2014 | 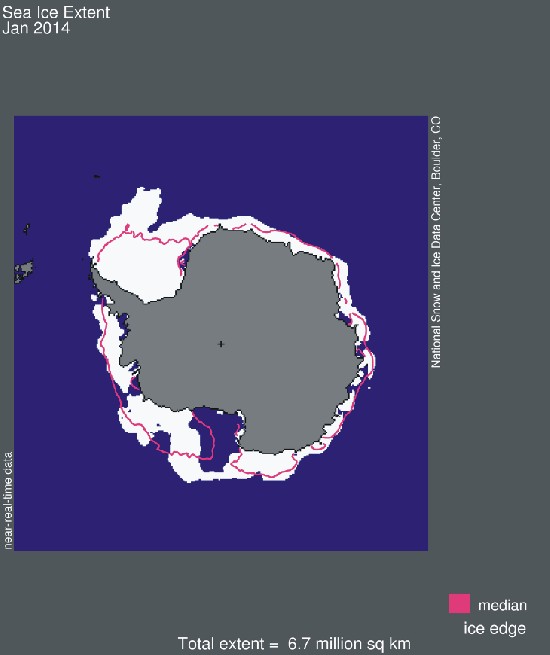 |
 |
 |
 |
 |
 |
 |
 |
 |
 |
 |
 |
| 2013 | 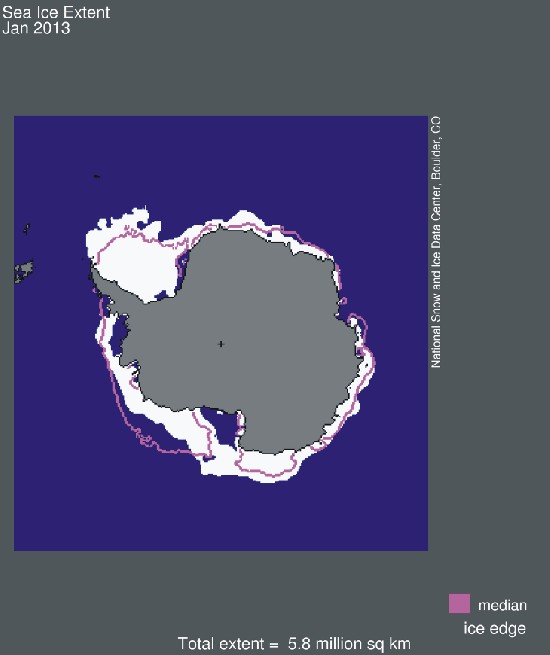 |
 |
 |
 |
 |
 |
 |
 |
 |
 |
 |
 |
| 2012 |  |
 |
 |
 |
 |
 |
 |
 |
 |
 |
 |
 |
| 2011 | 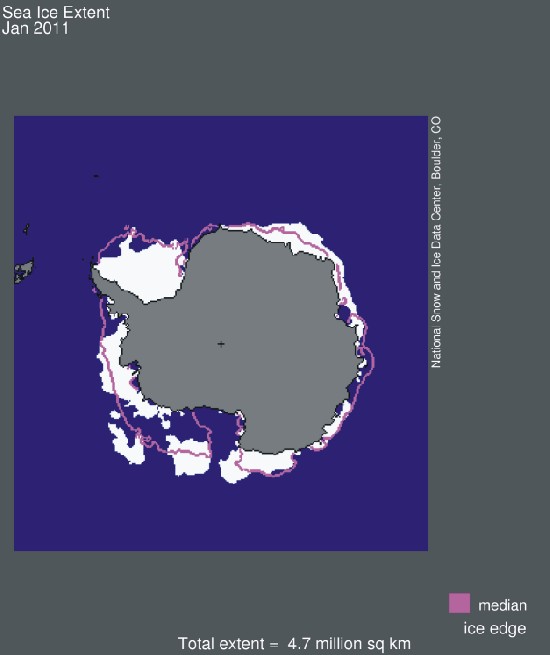 |
 |
 |
 |
 |
 |
 |
 |
 |
 |
 |
 |
| 2010 | 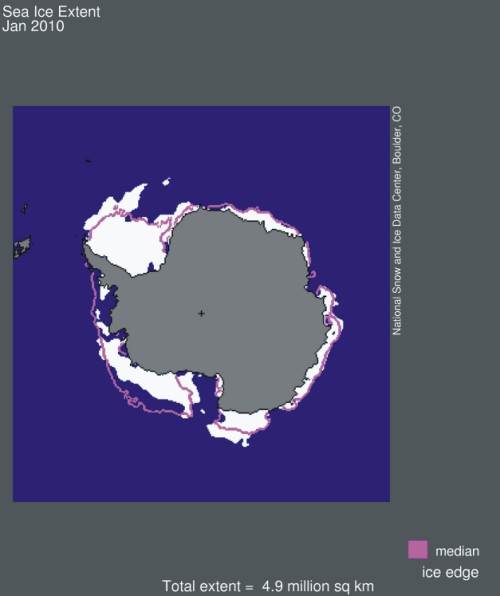 |
 |
 |
 |
 |
 |
 |
 |
 |
 |
 |
 |
| 2009 | 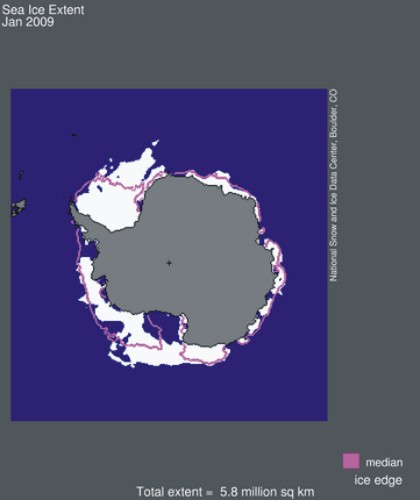 |
 |
 |
 |
 |
 |
 |
 |
 |
 |
 |
 |
| 2008 |  |
 |
 |
 |
 |
 |
 |
 |
 |
 |
 |
 |
| 2007 | 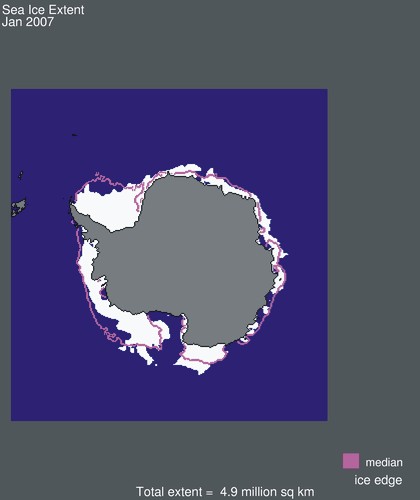 |
 |
 |
 |
 |
 |
 |
 |
 |
 |
 |
|
| 2006 |  |
 |
 |
 |
 |
 |
 |
 |
 |
 |
 |
 |
| 2005 |  |
 |
 |
 |
 |
 |
 |
 |
 |
 |
 |
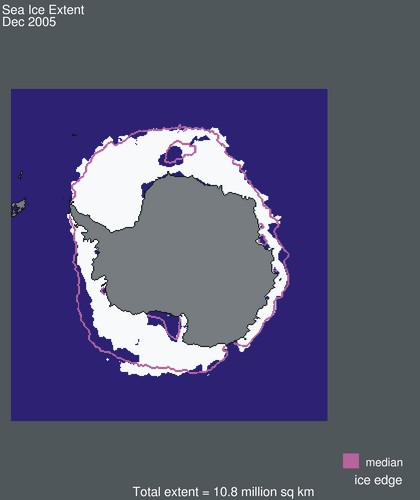 |
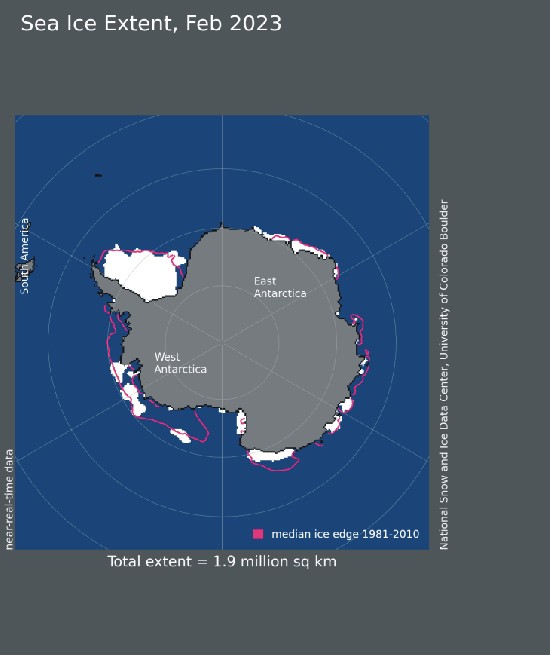
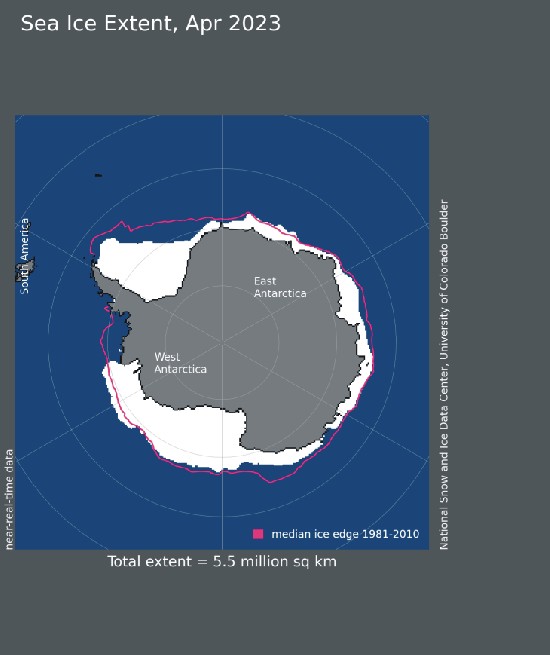
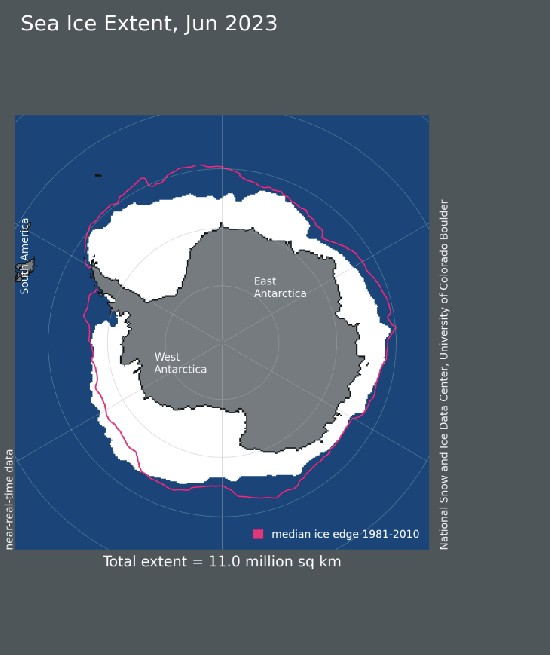
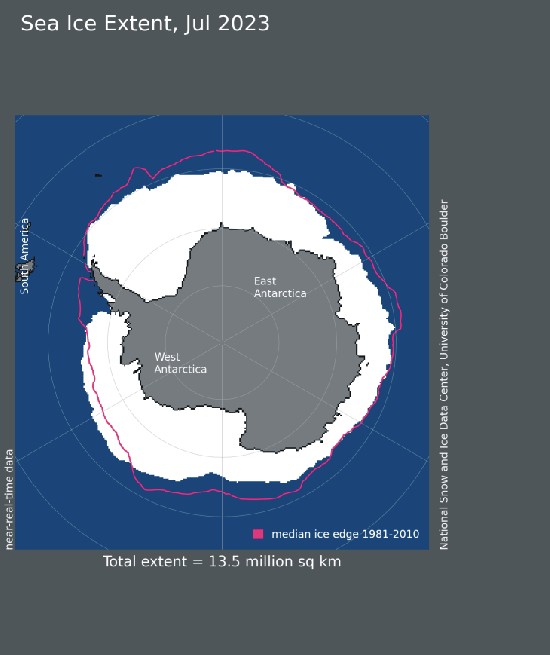
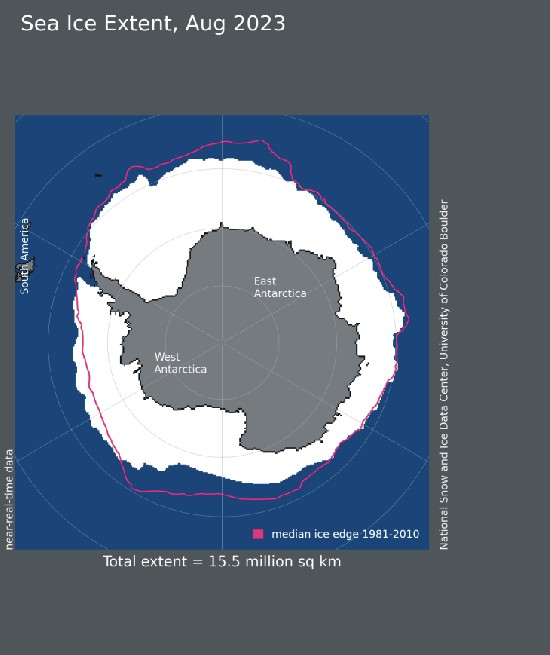
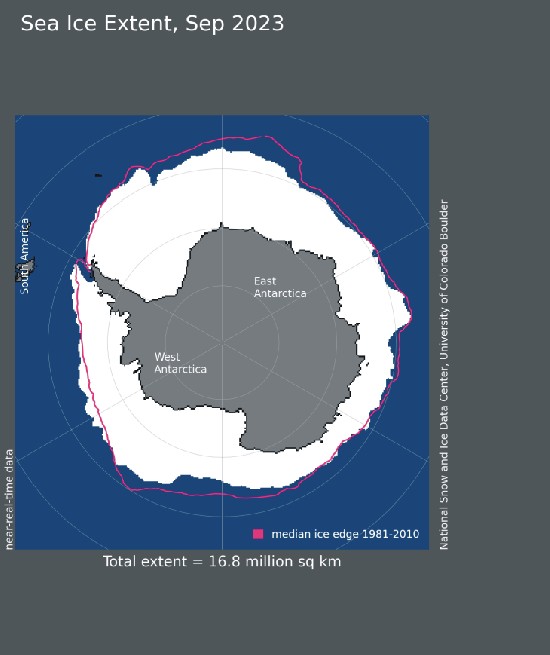
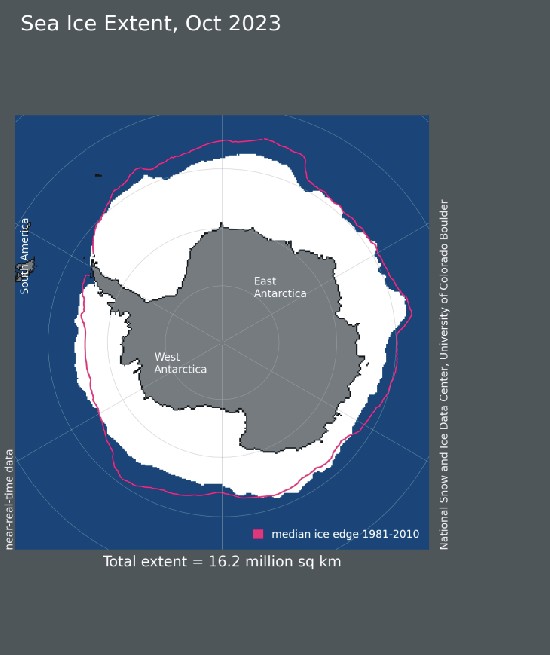
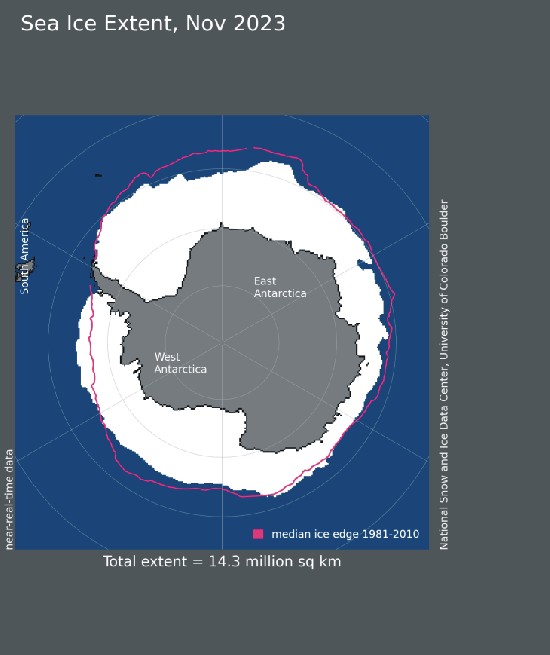
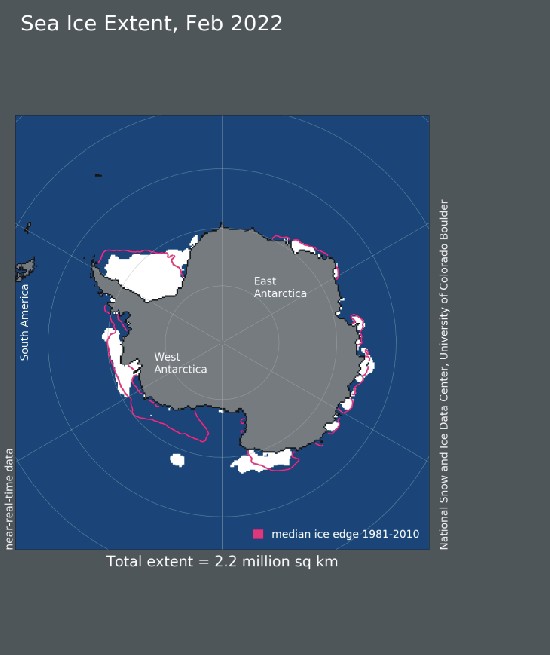
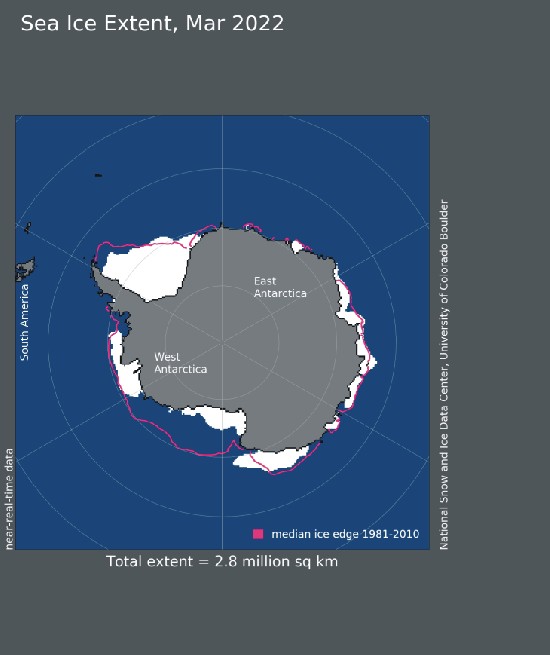
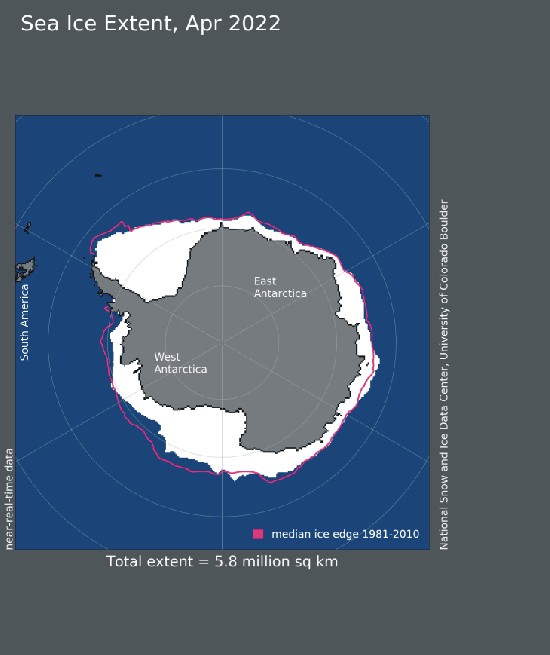
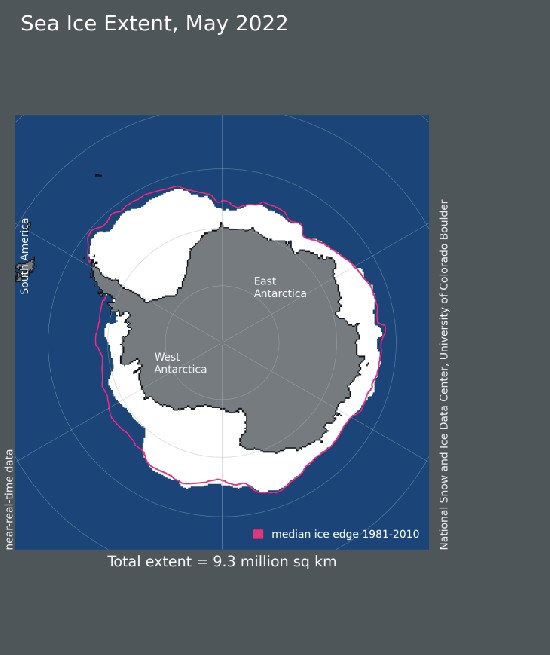
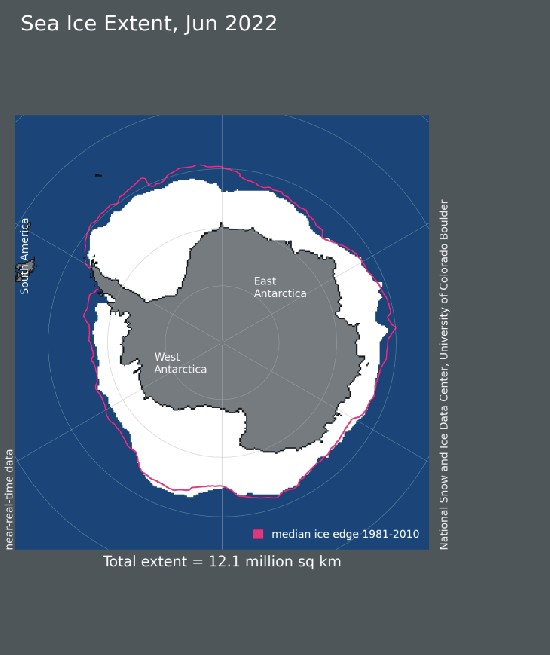
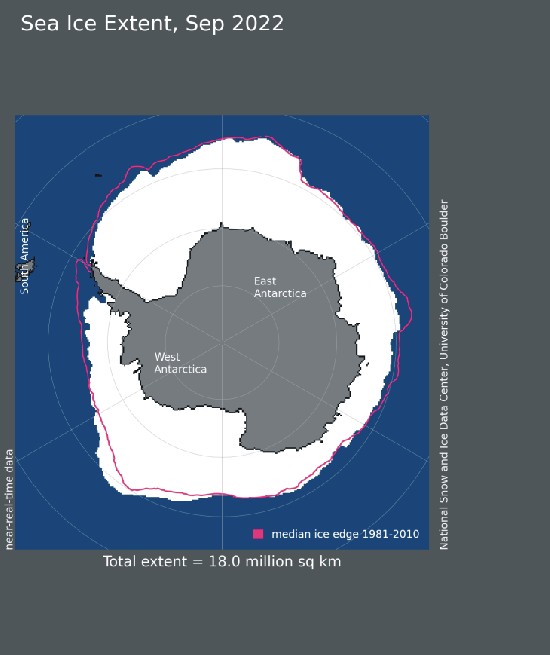
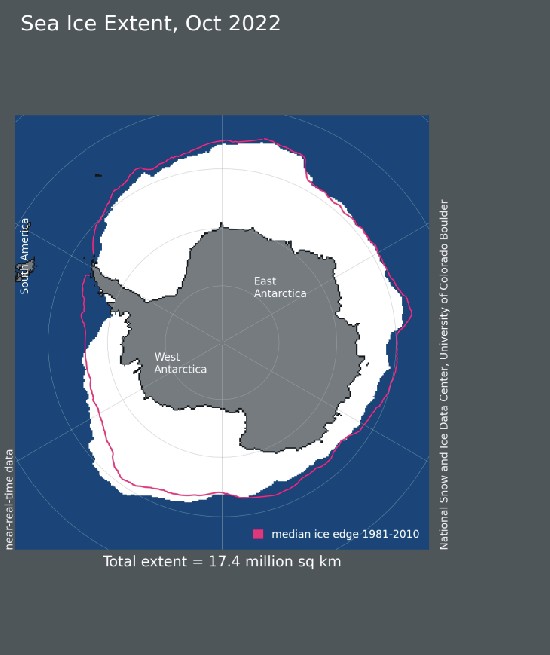
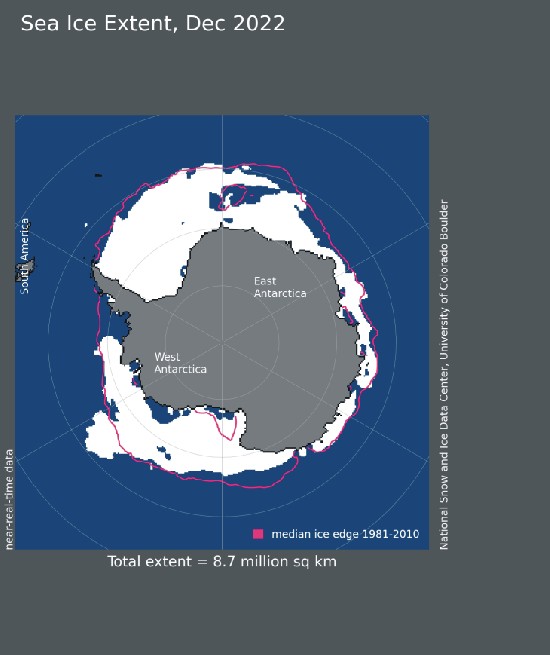
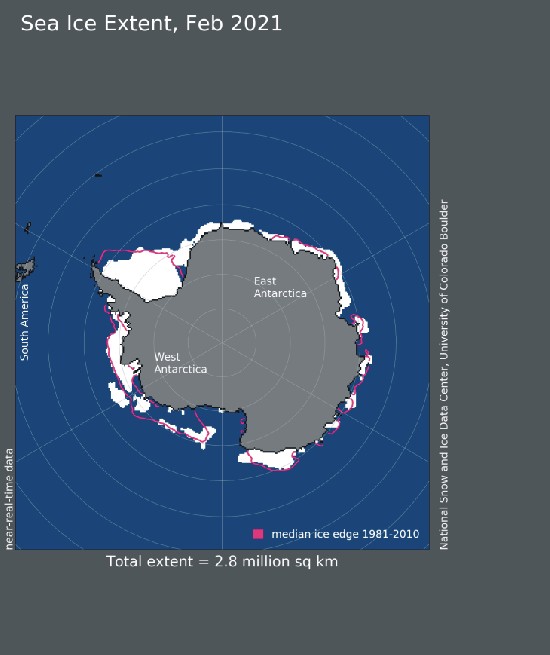
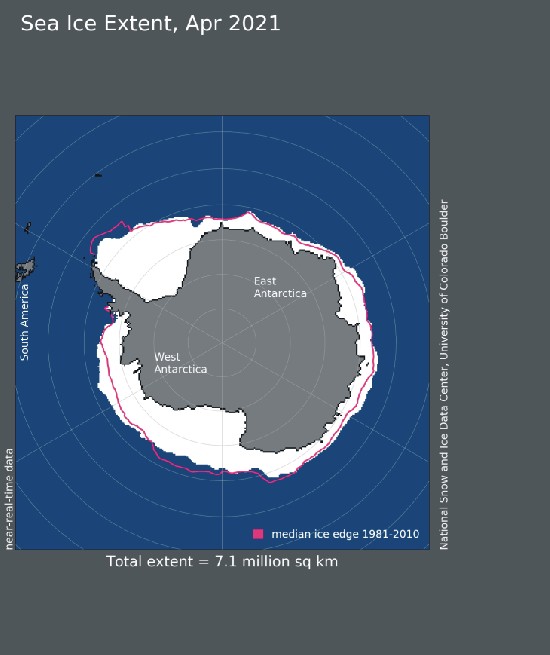
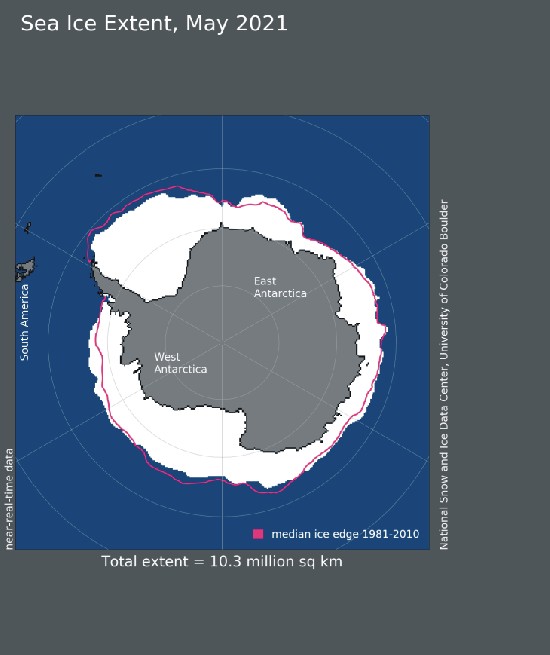
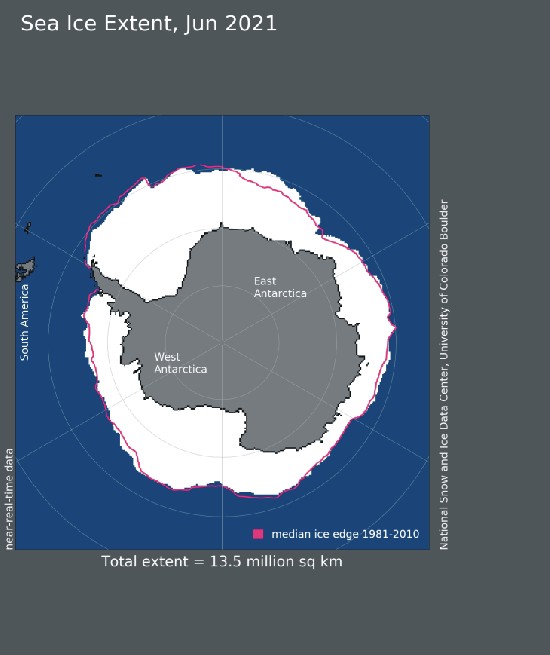
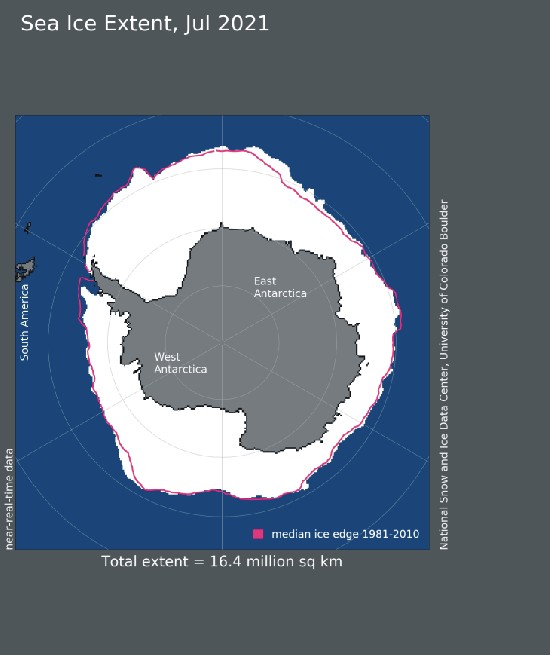
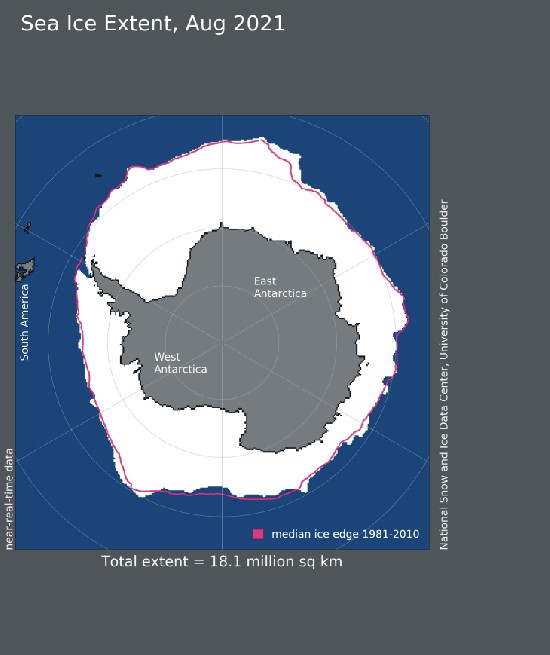
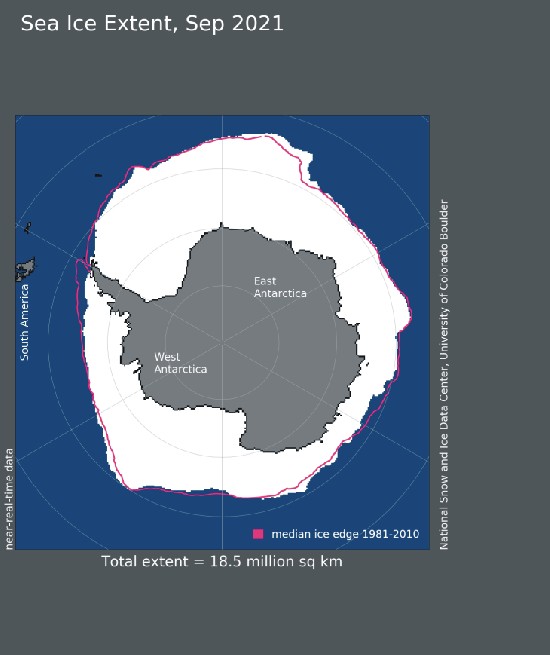
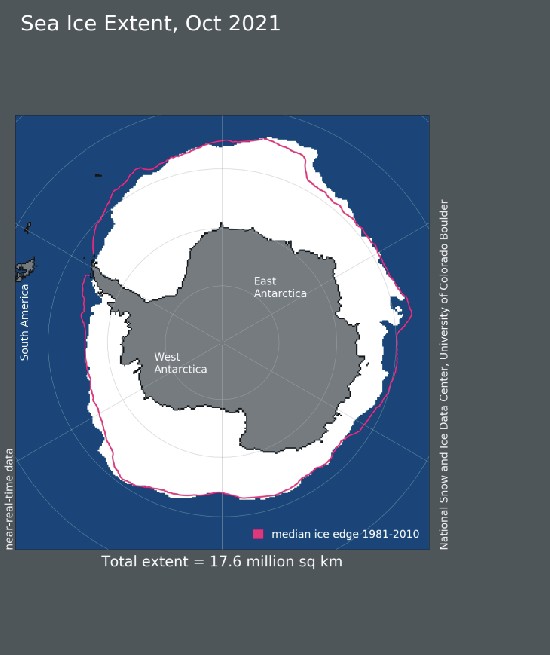
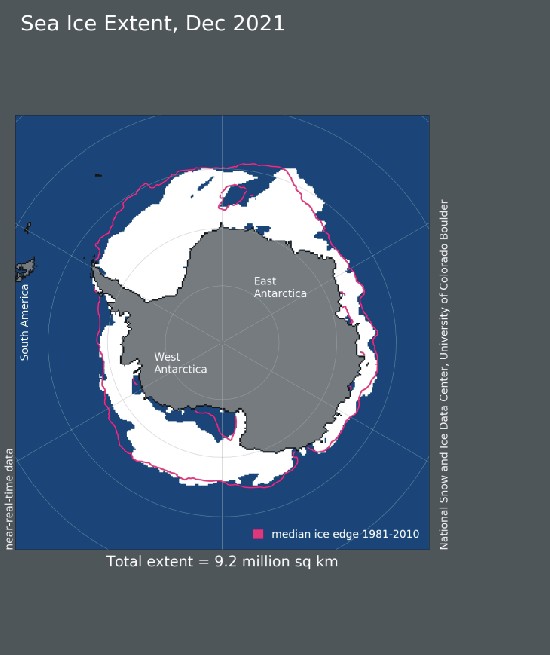
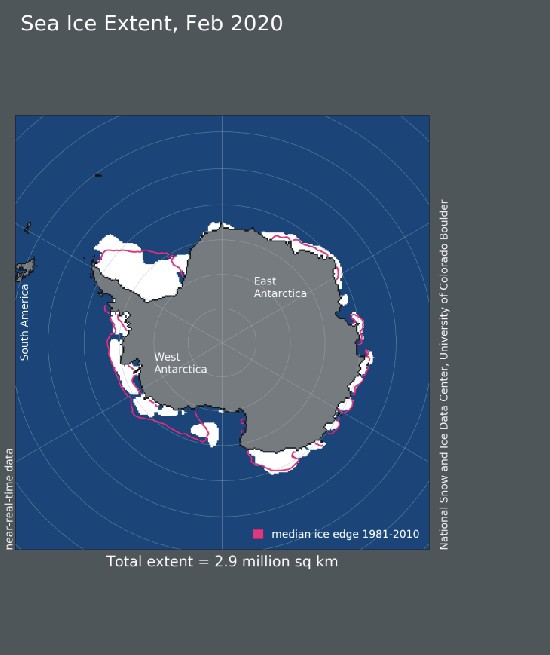
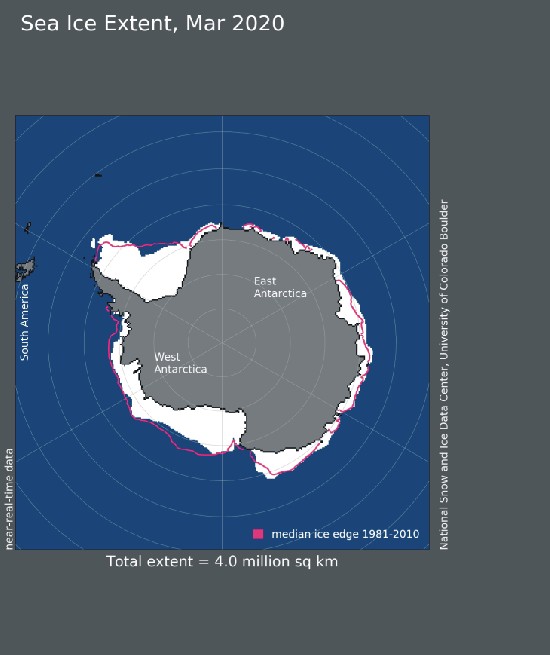
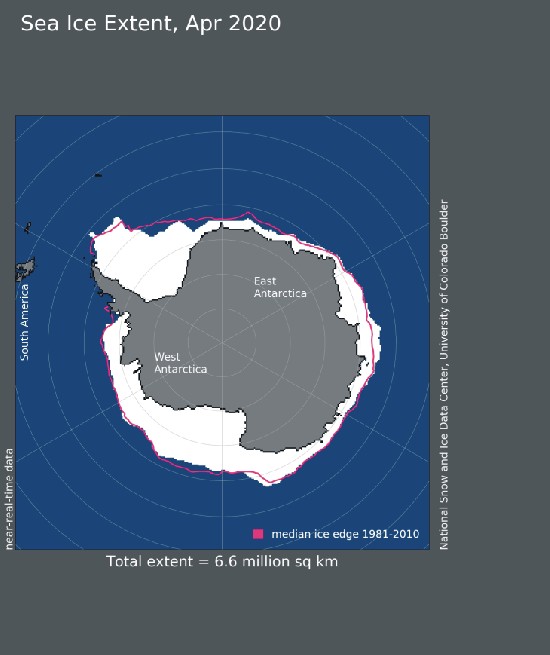
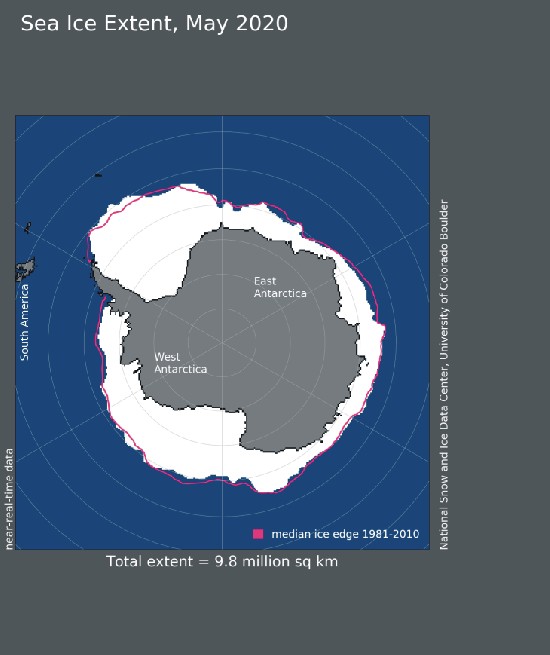
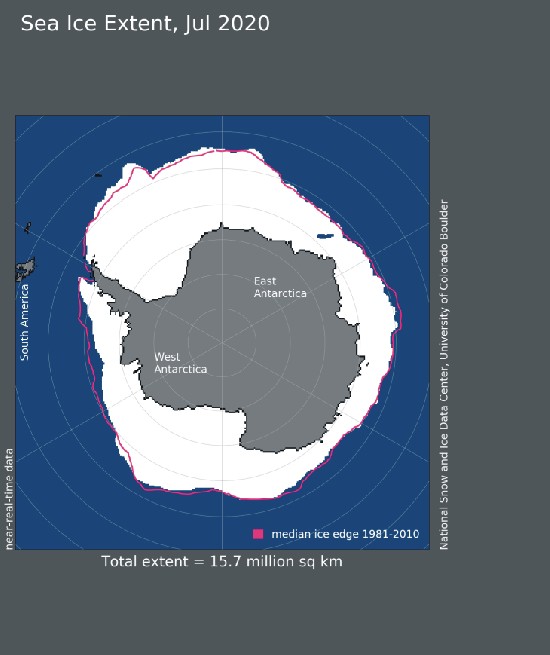
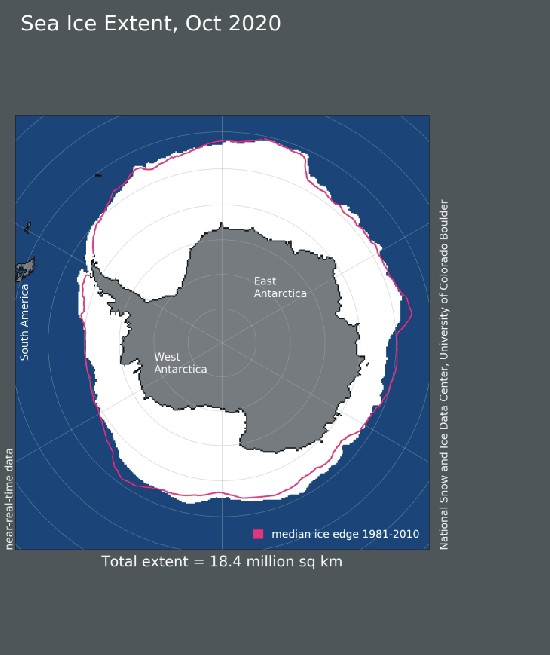
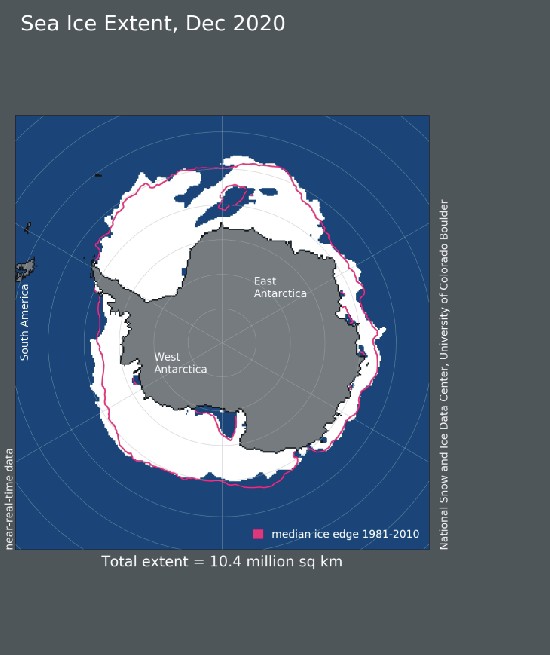
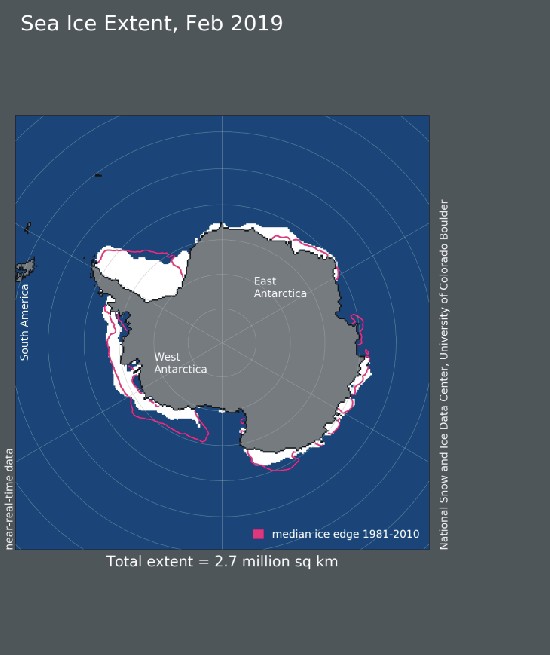
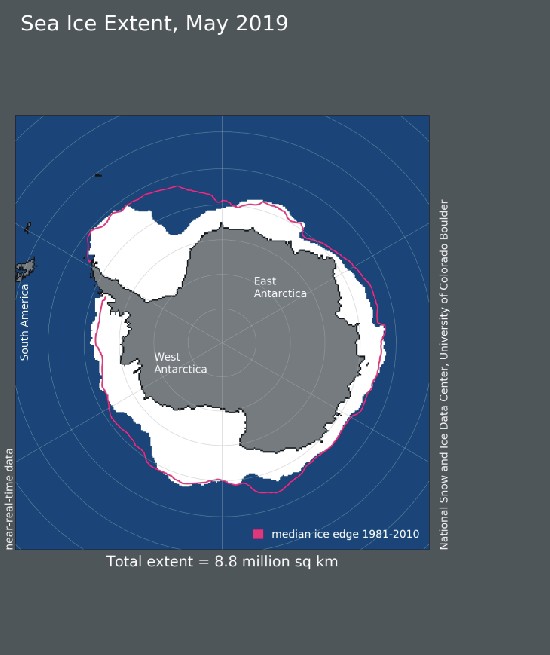
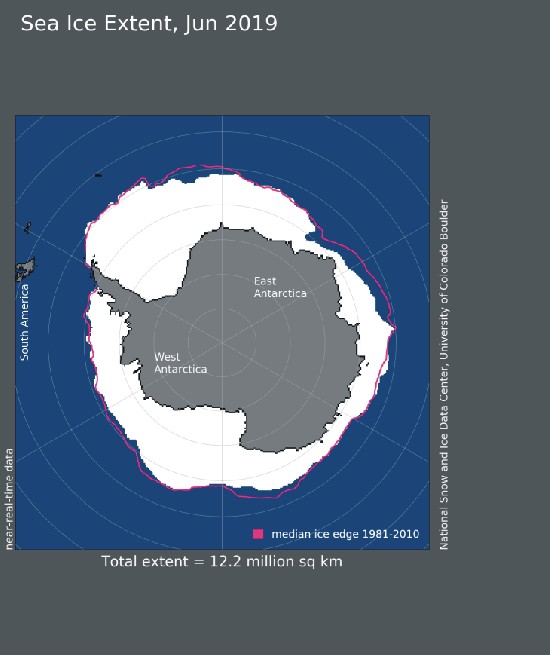
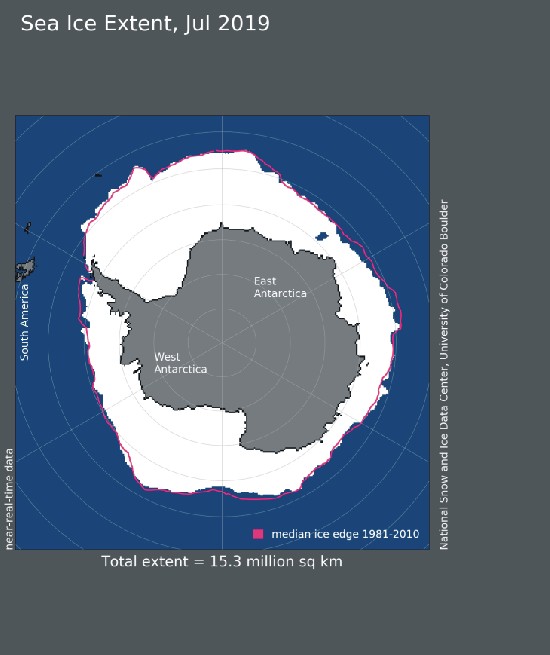
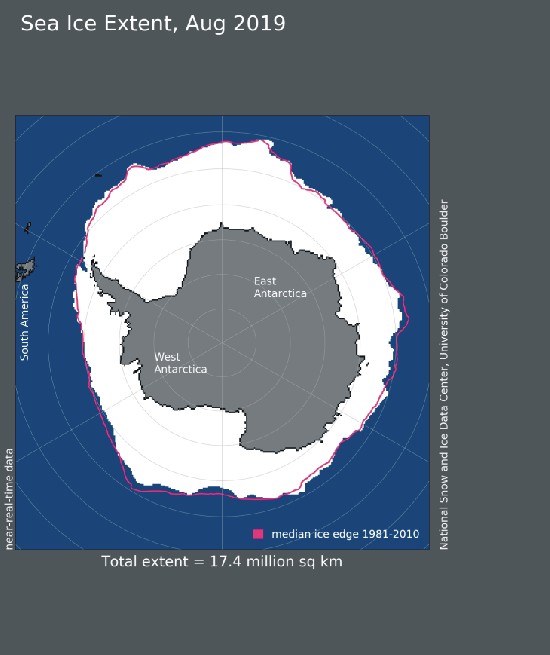
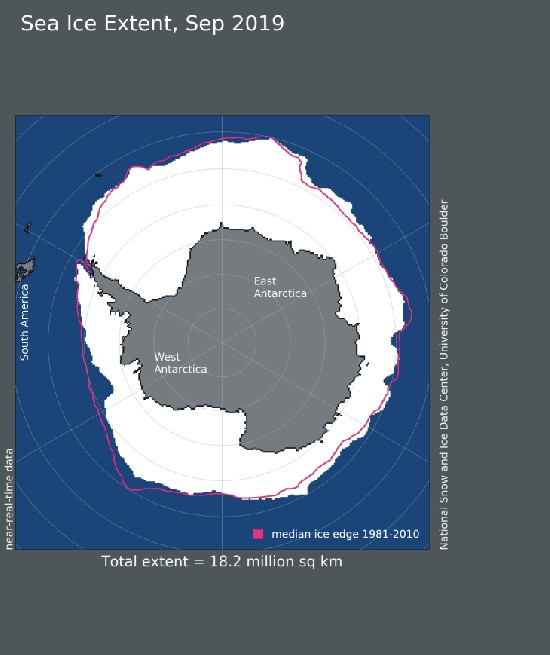
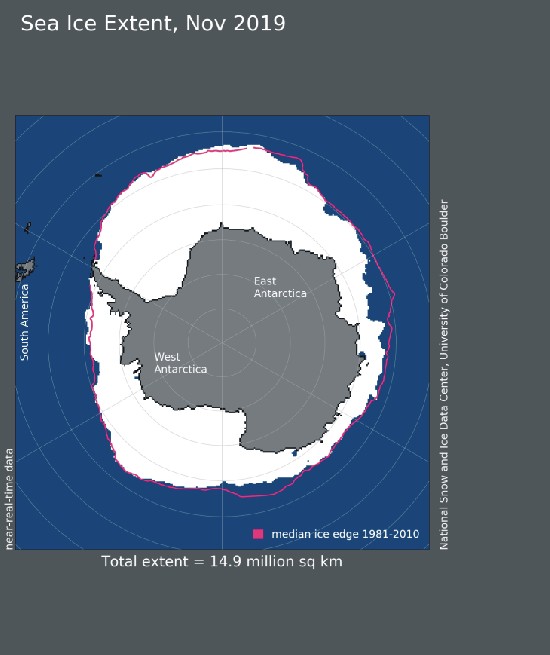
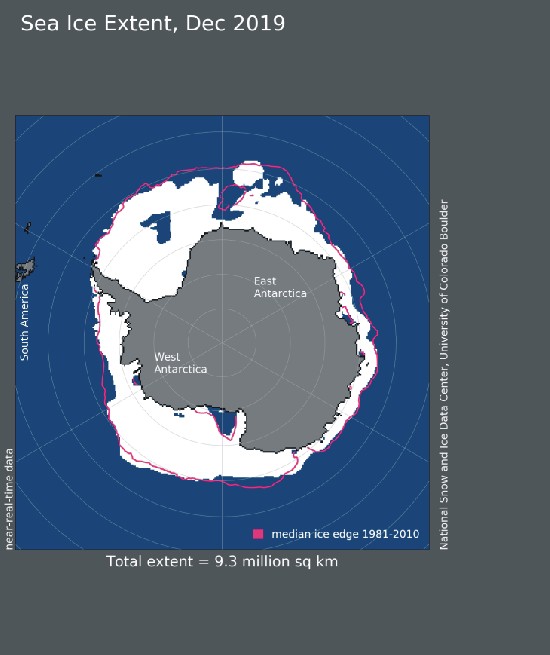
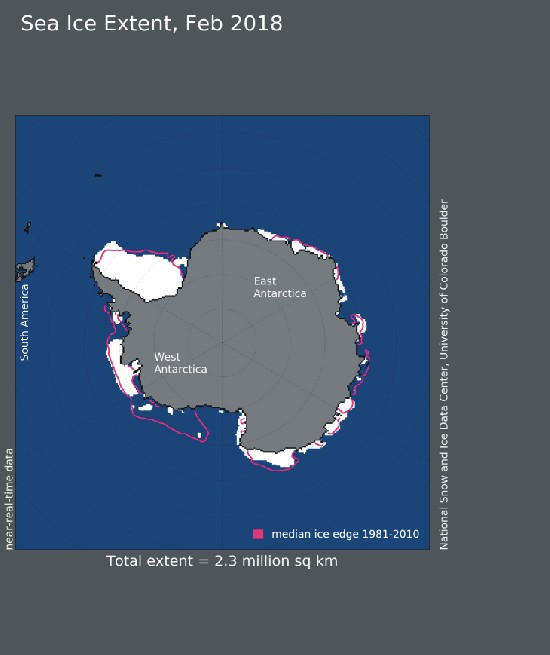
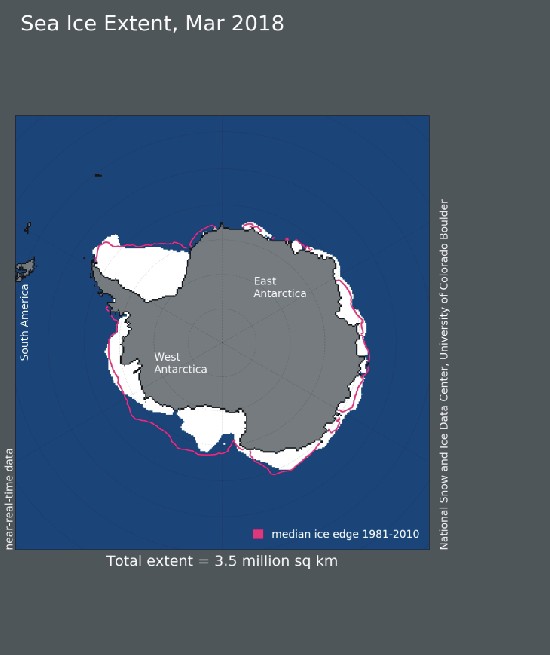
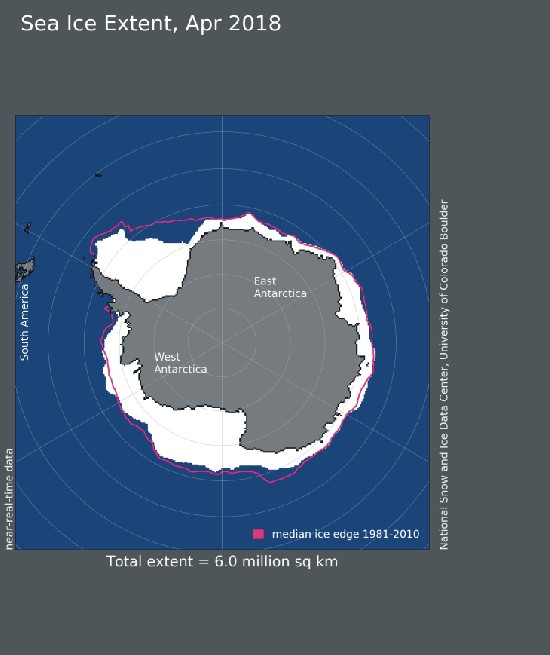
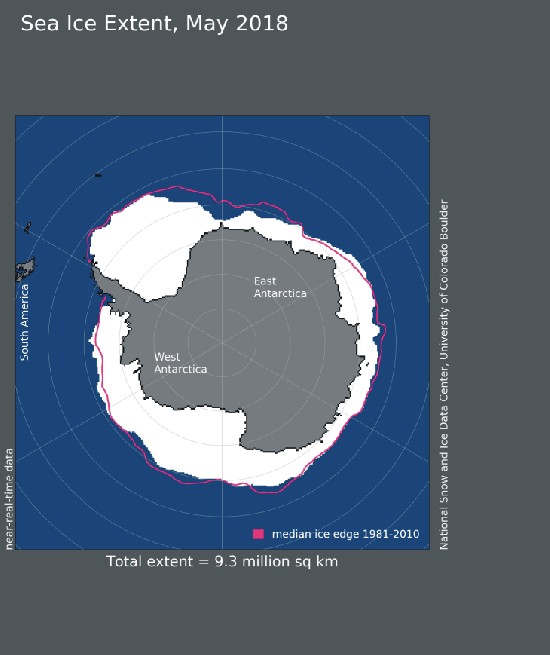
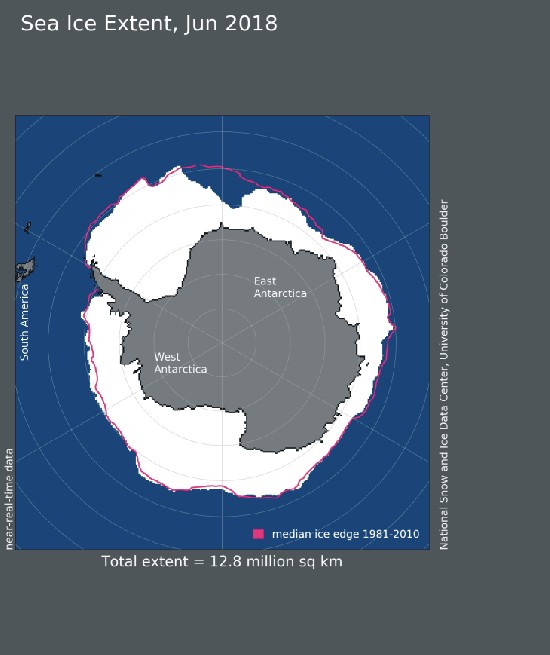
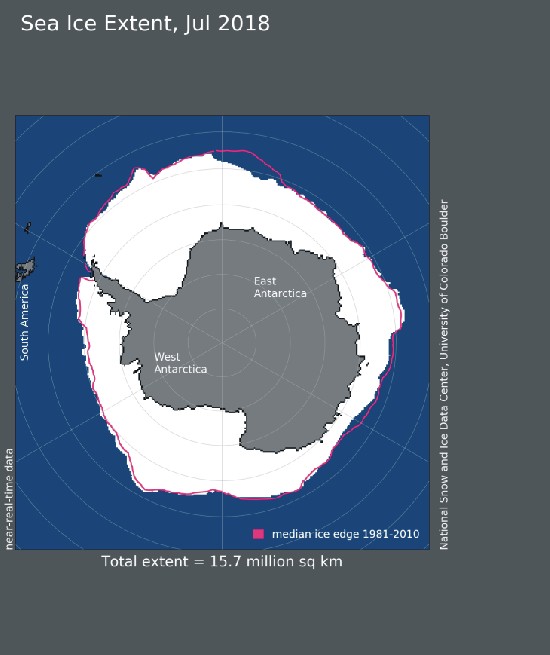
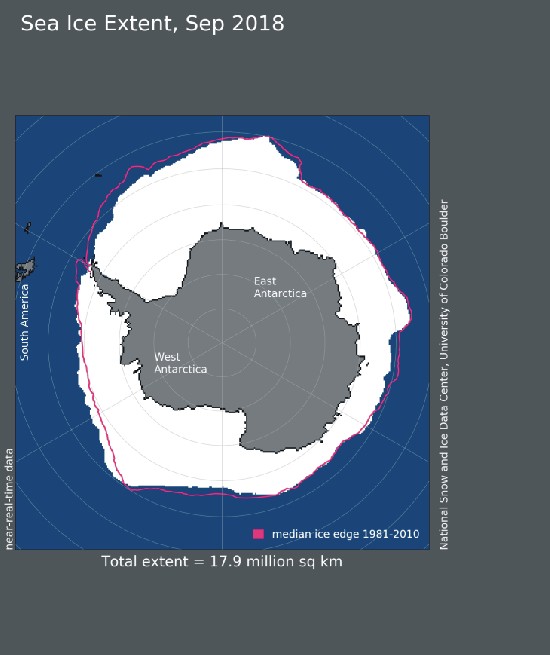
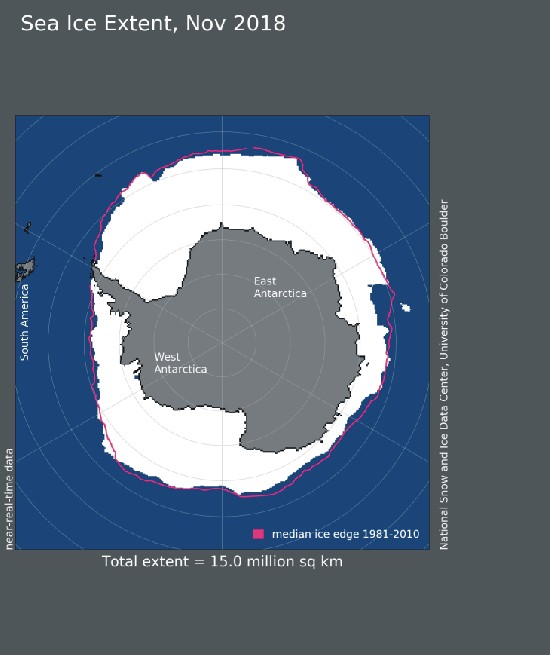
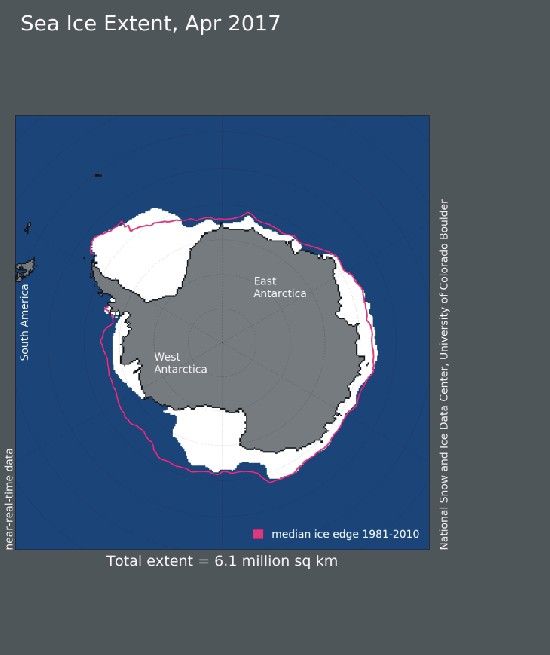
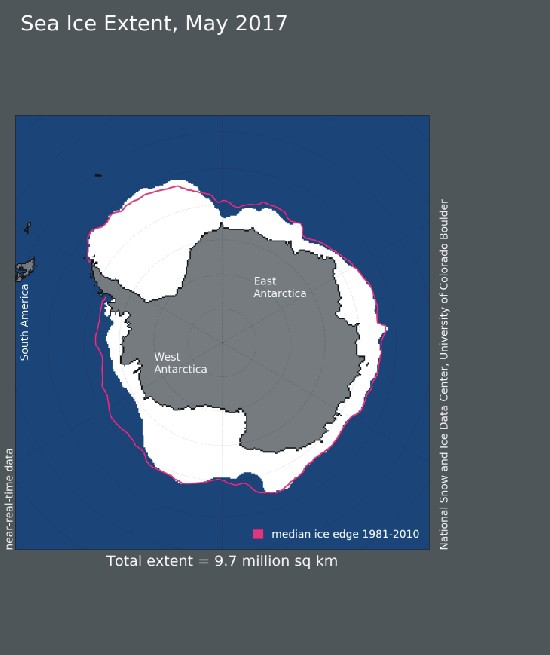
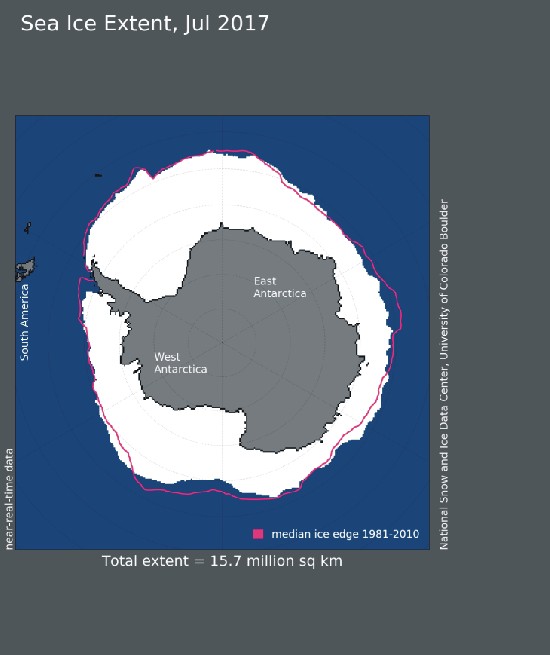
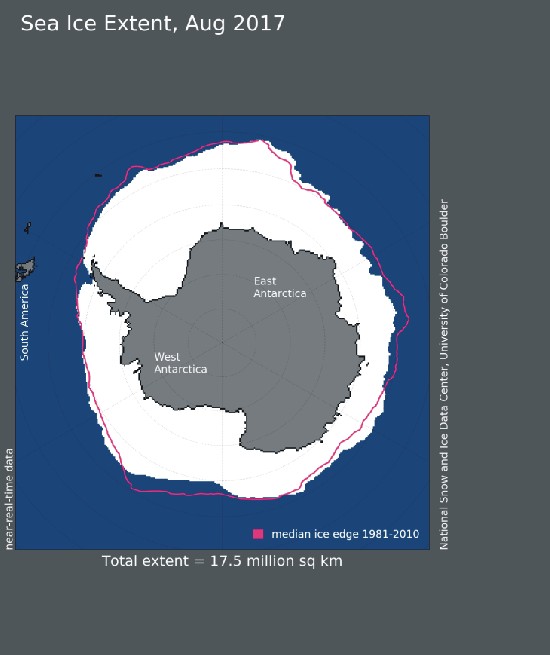
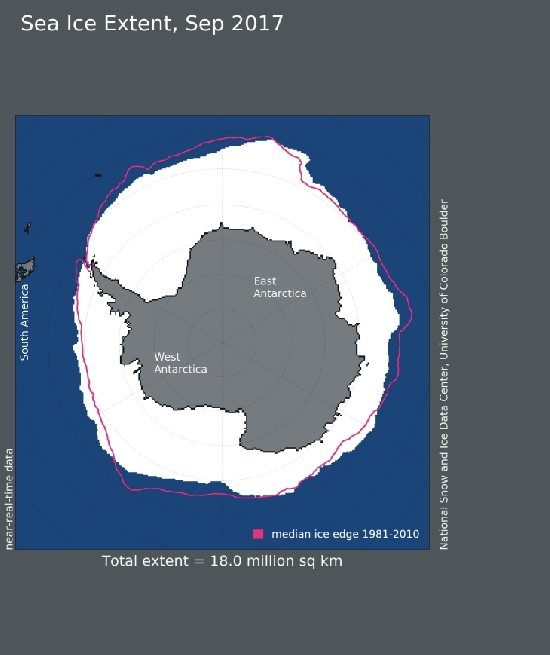
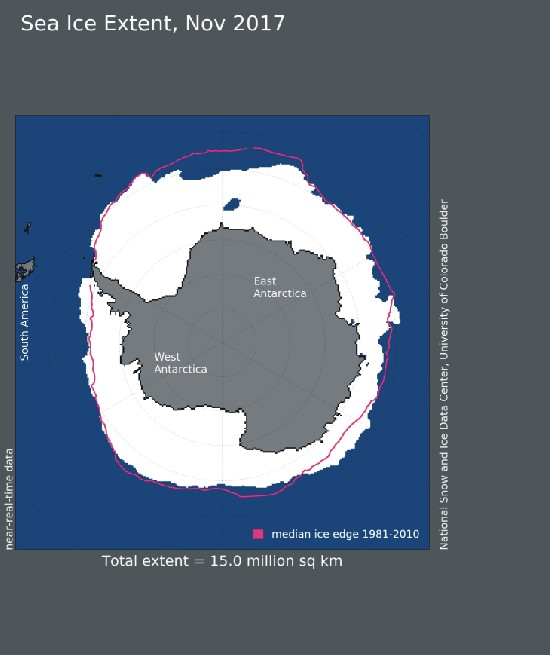
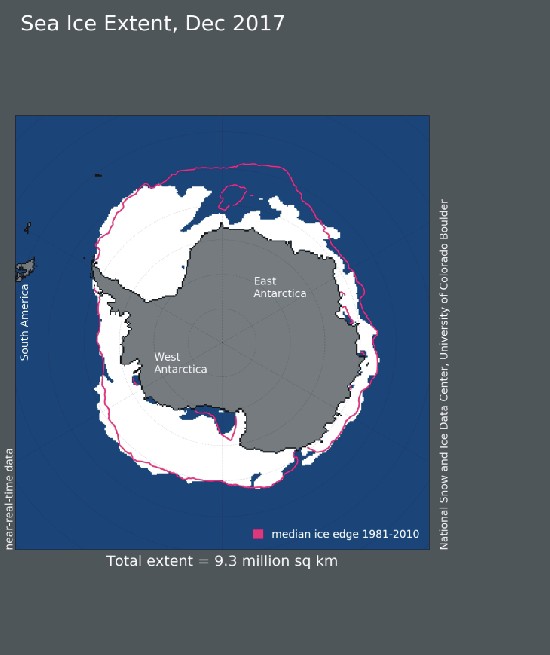
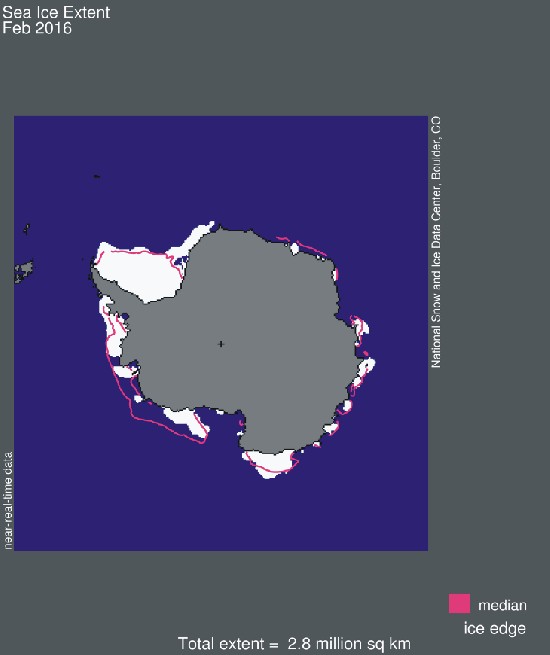
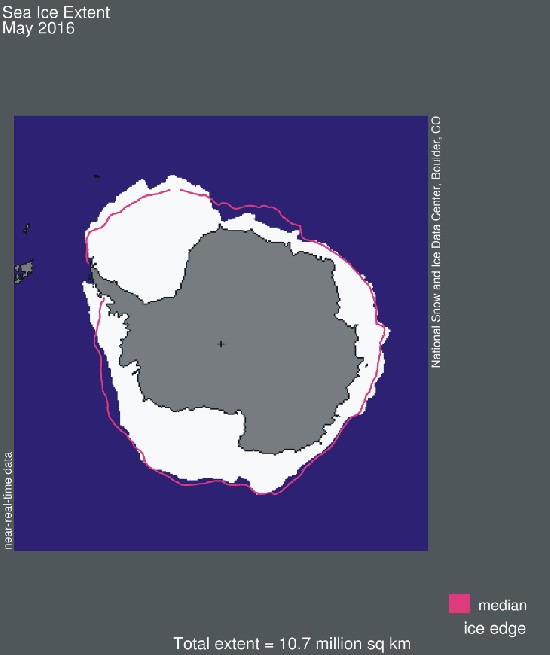
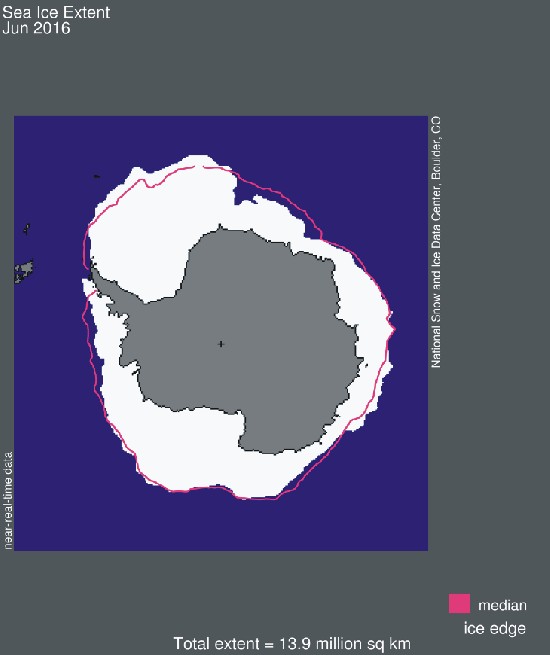
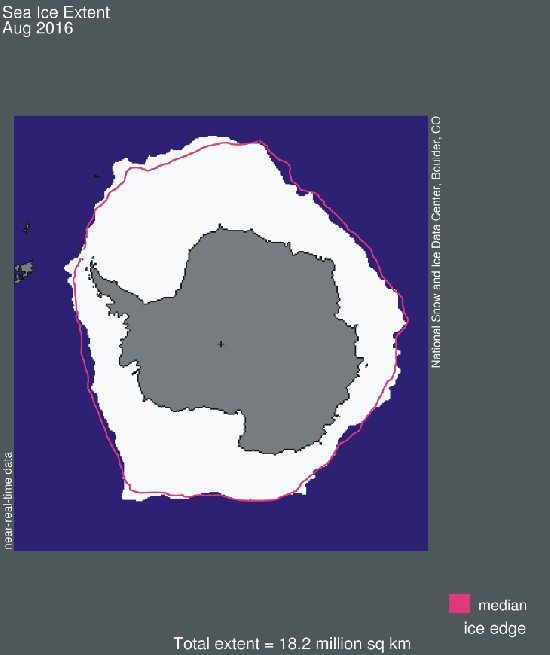
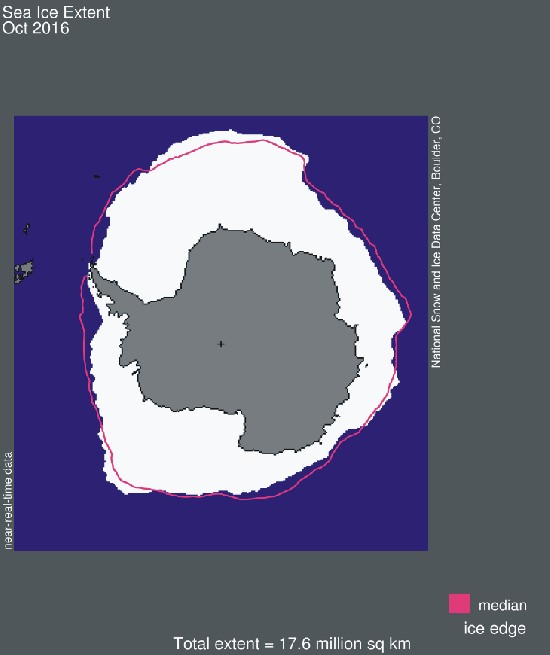
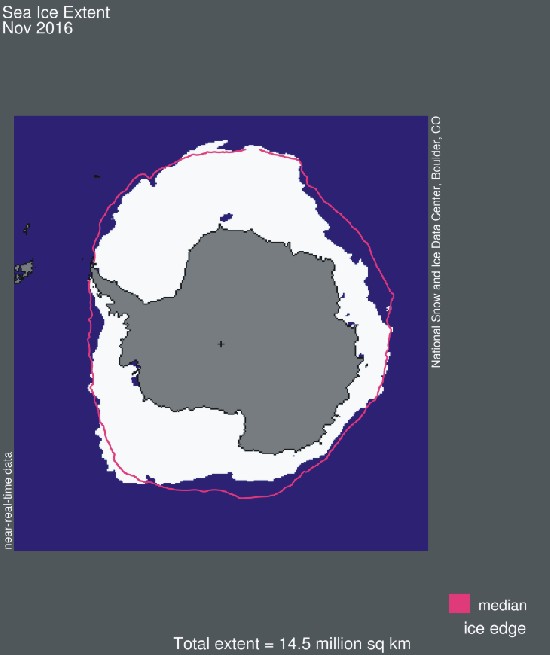
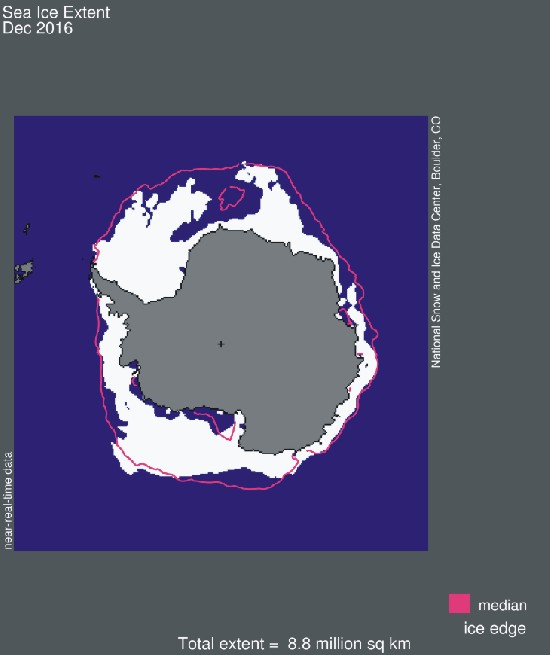
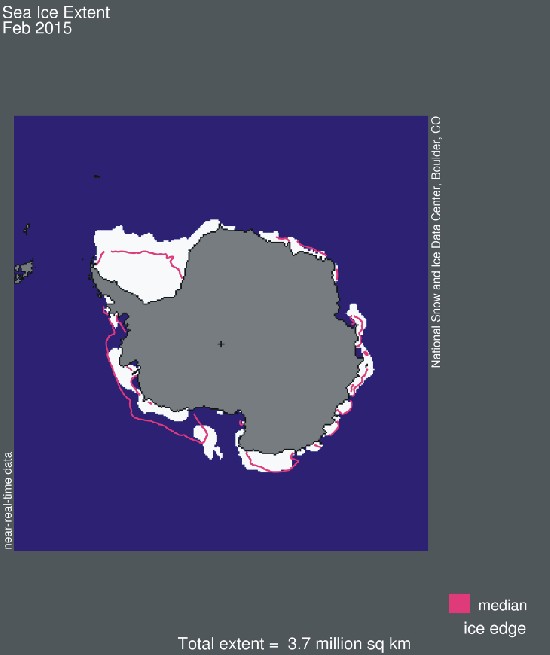
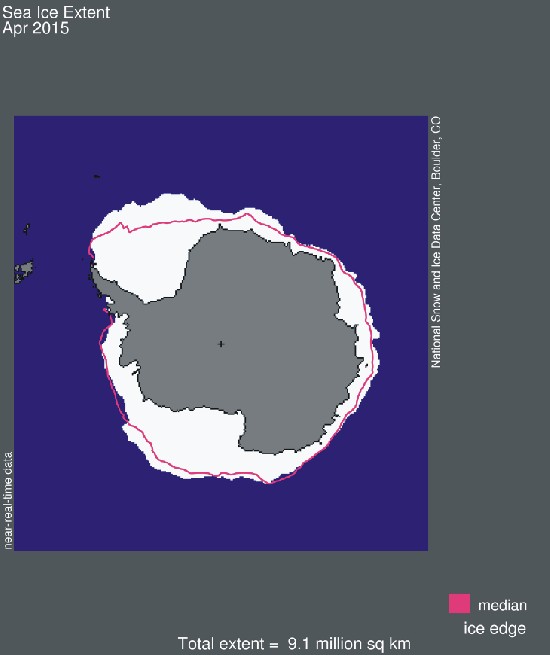
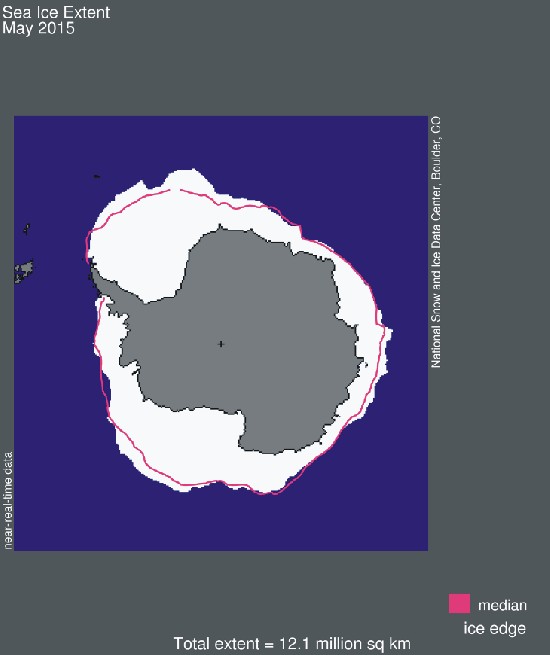
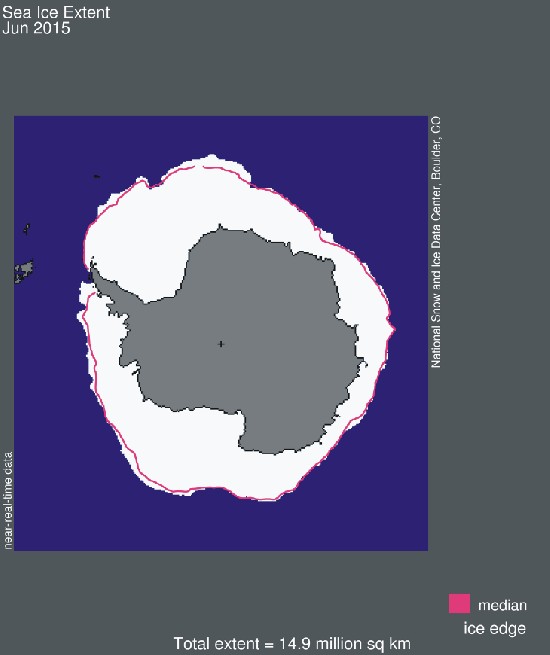
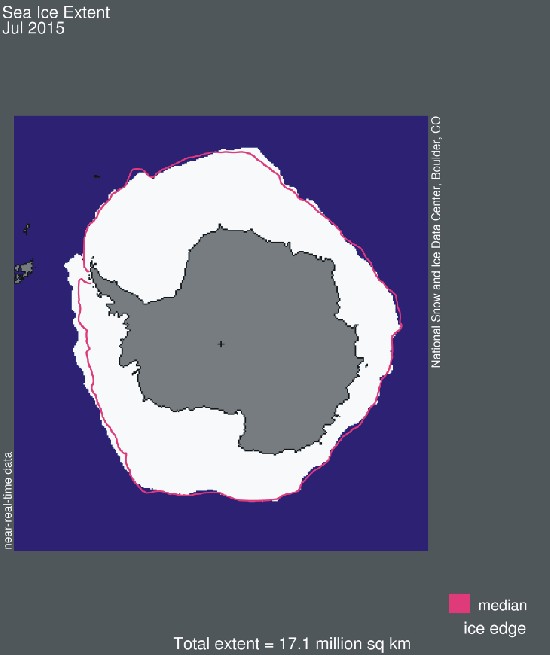
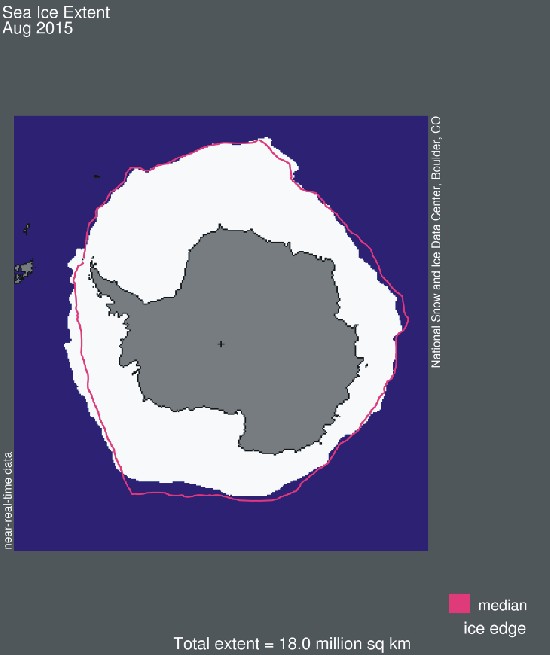
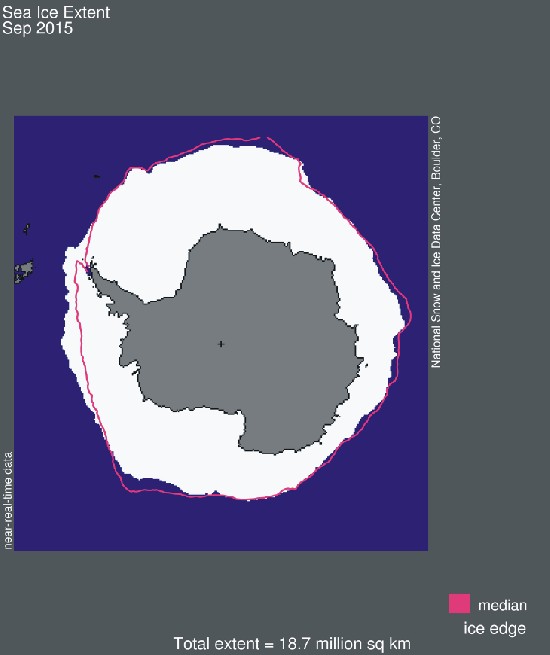
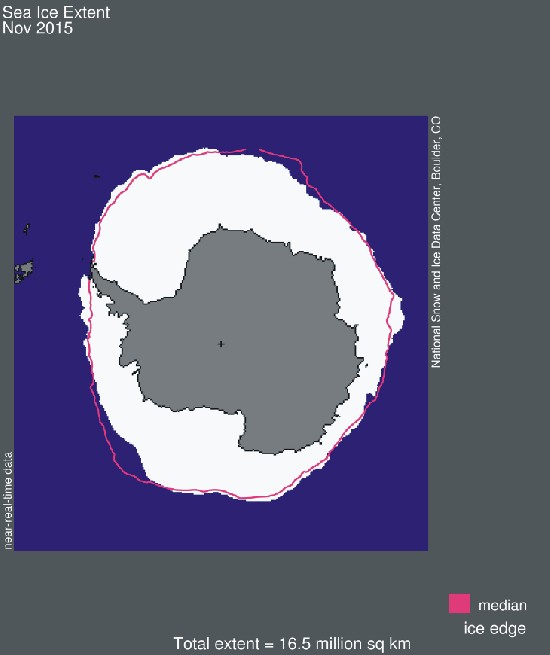
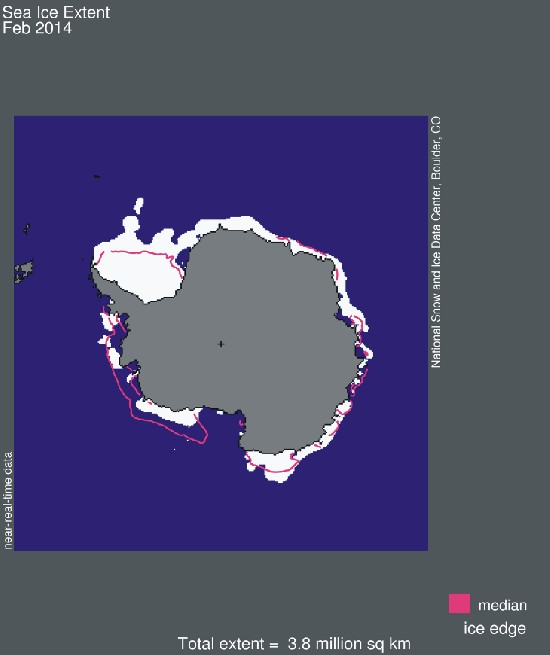
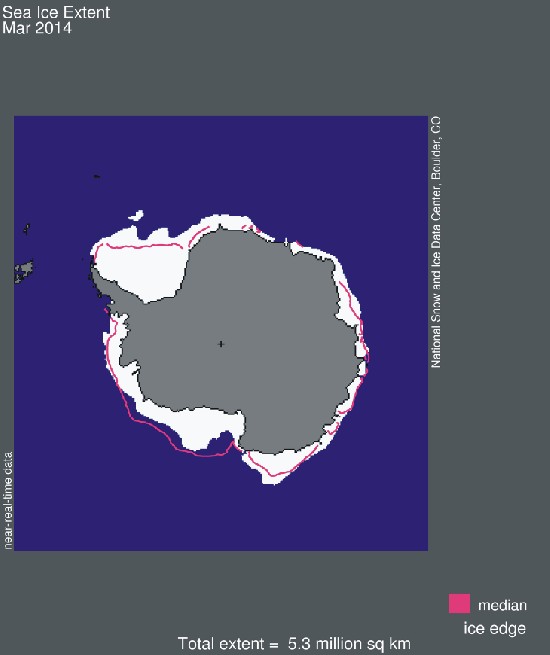
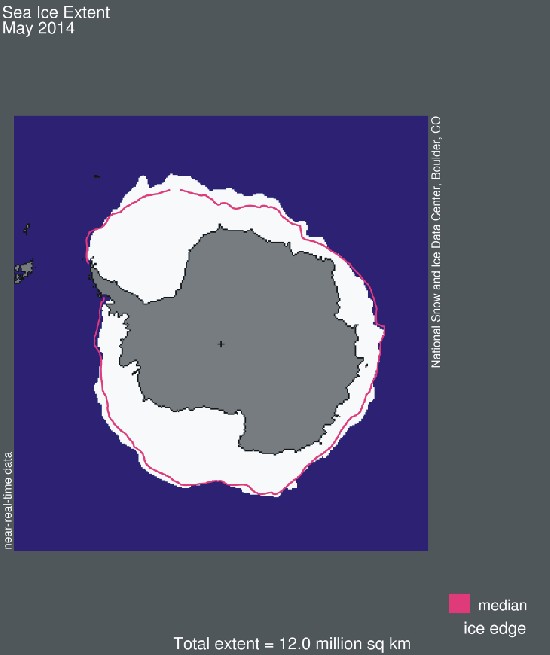
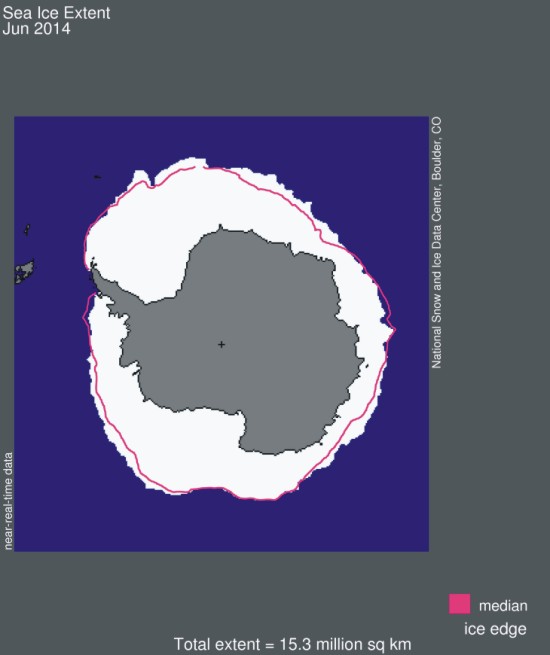
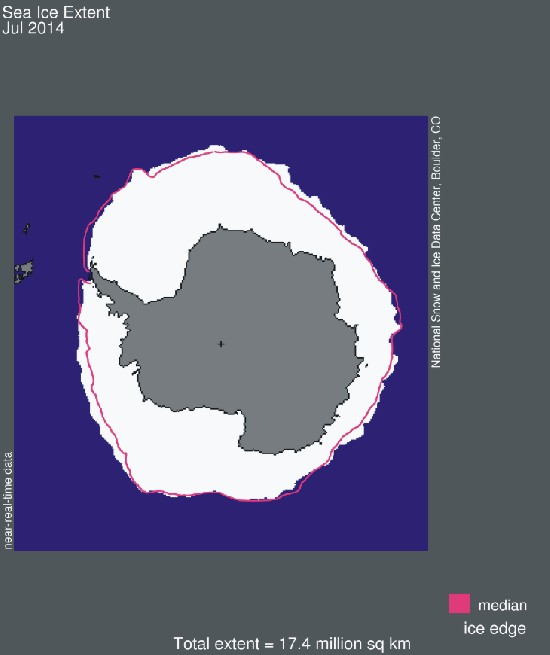
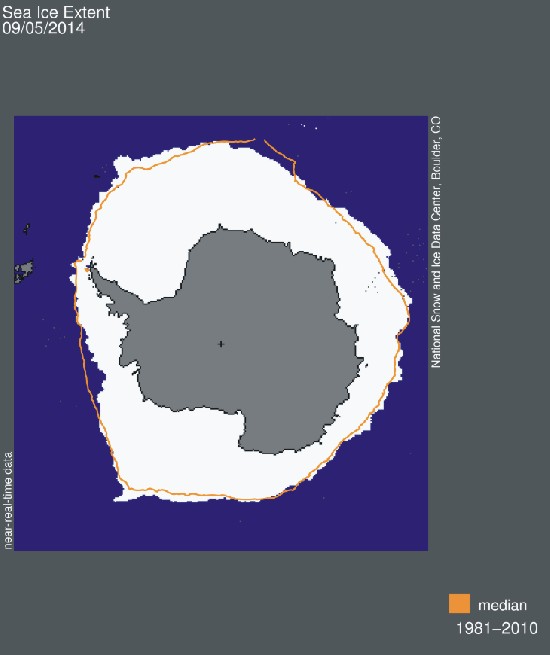
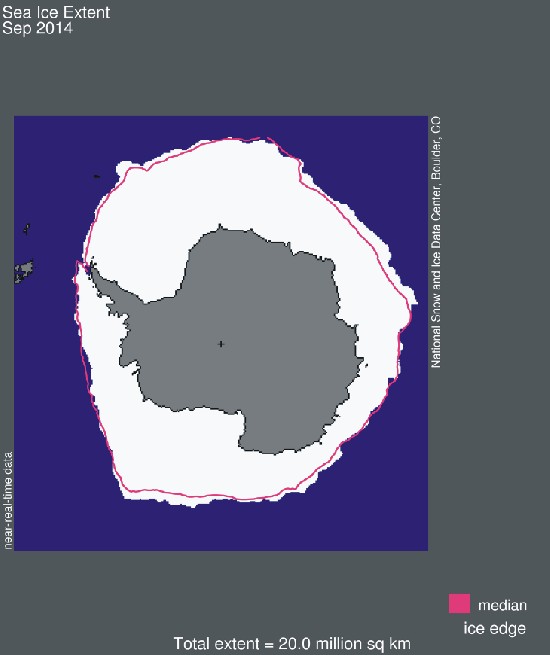
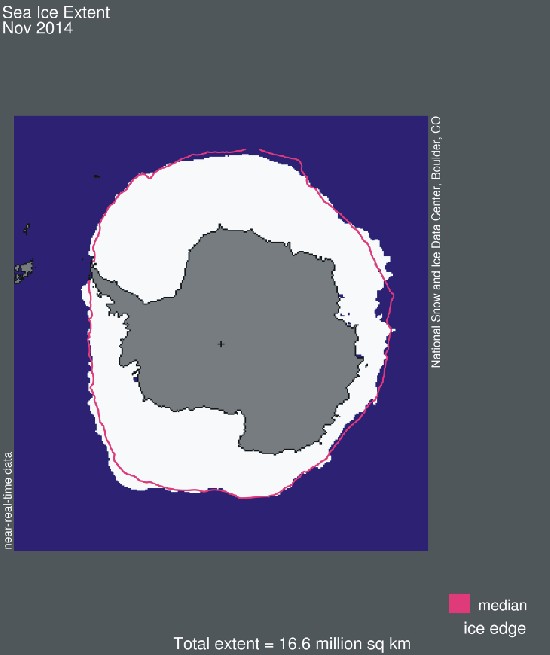
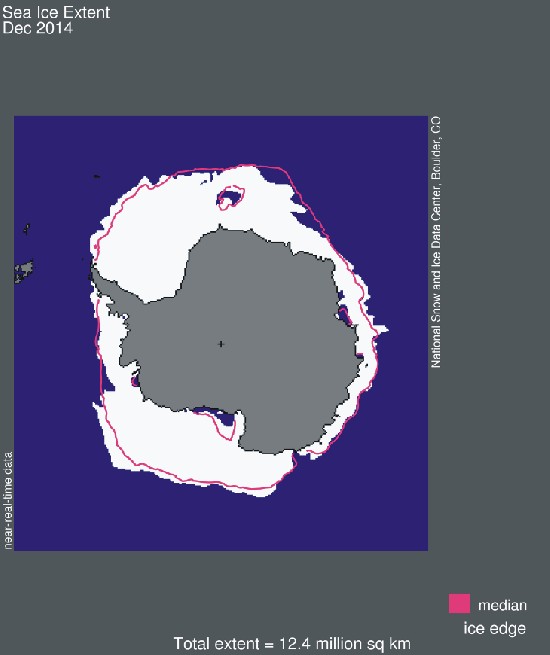
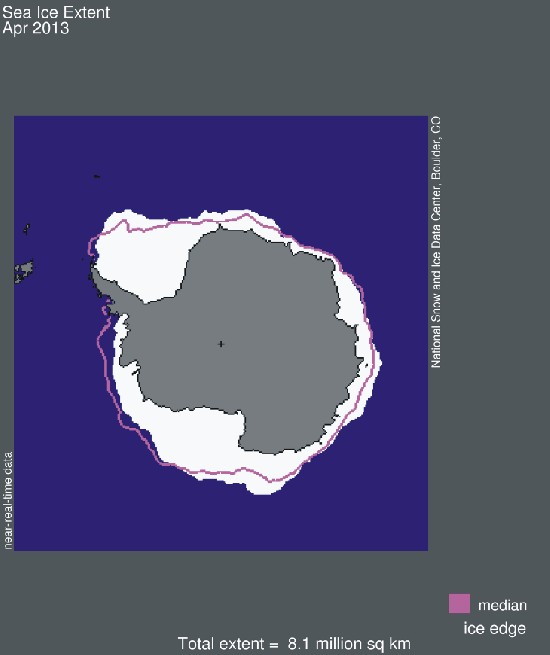
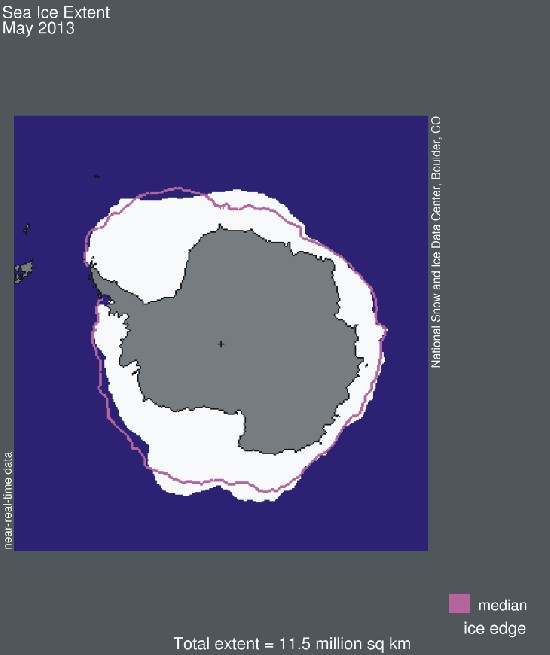
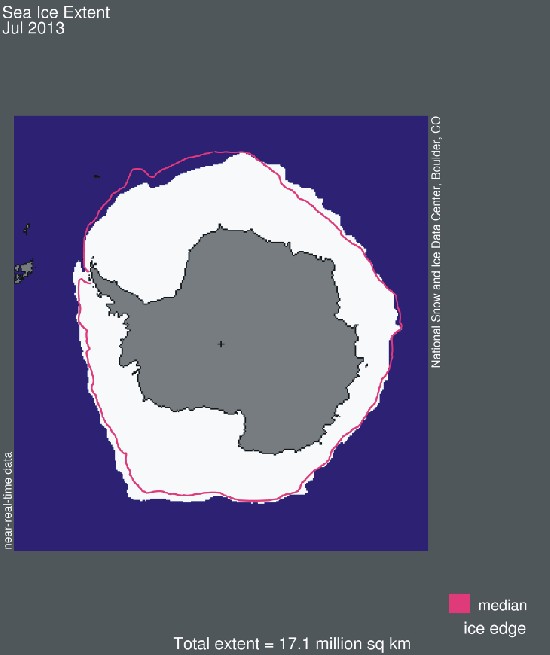
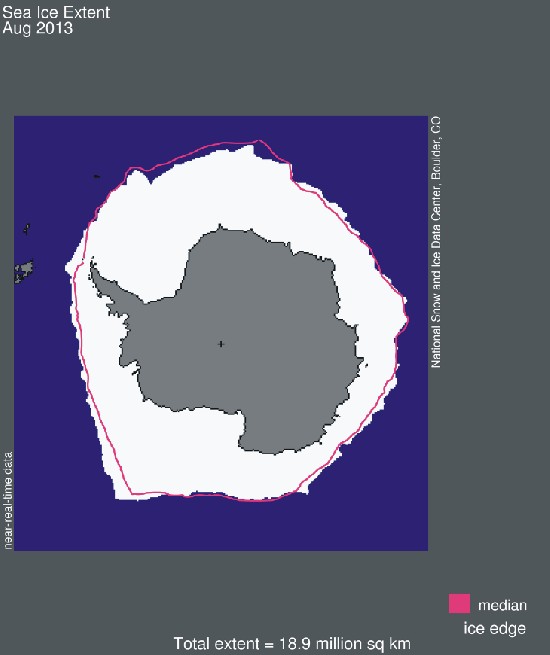
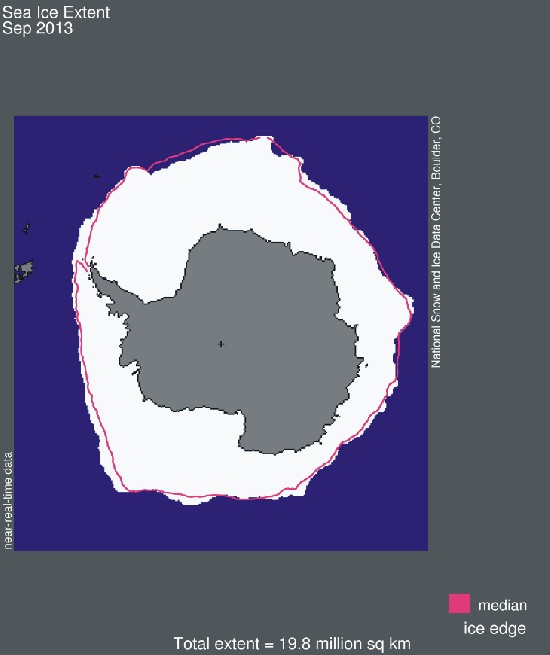
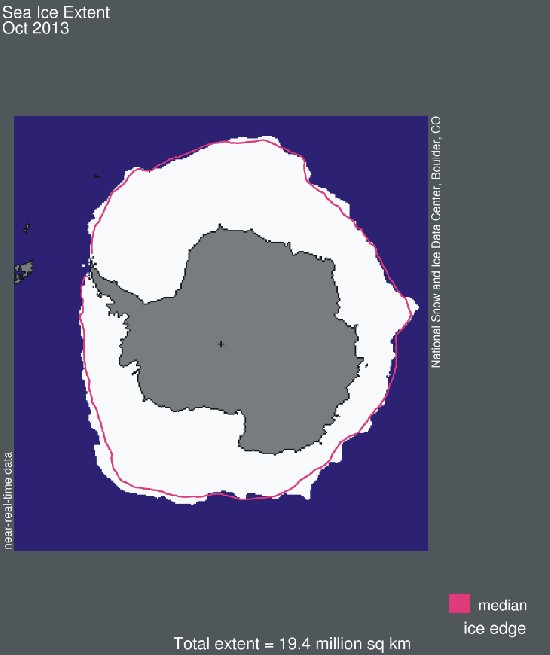
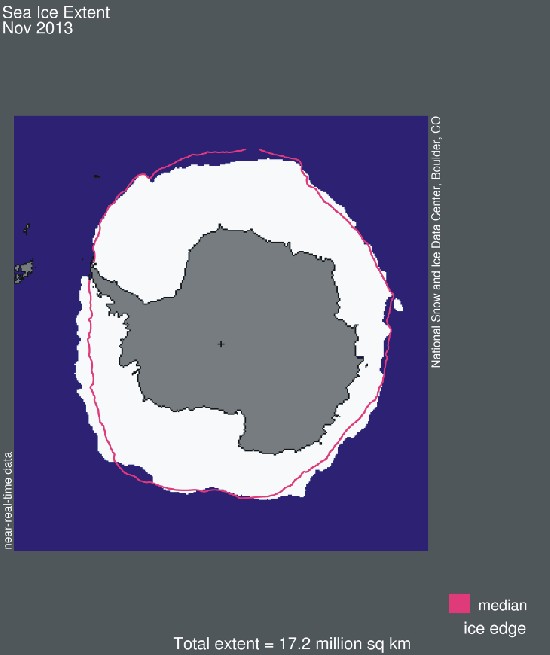
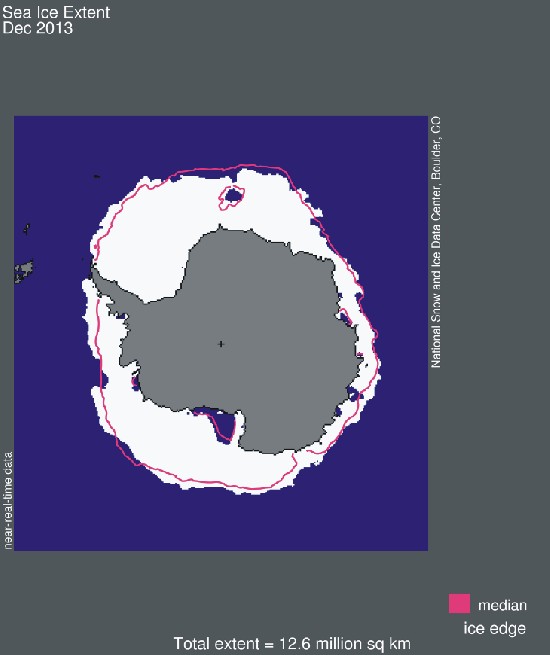
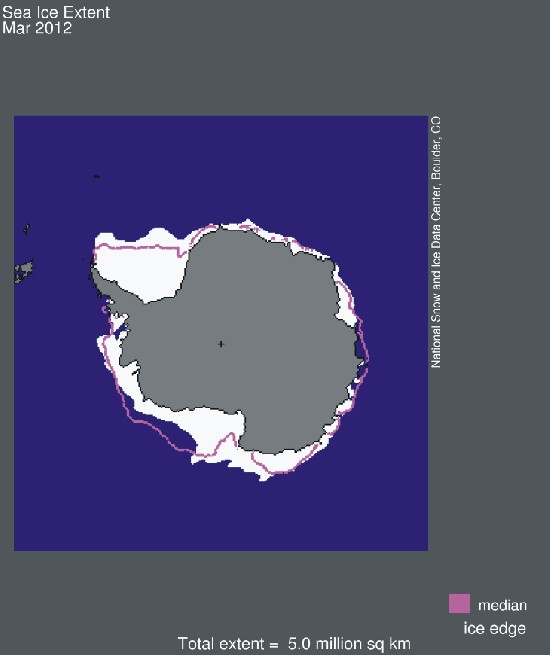
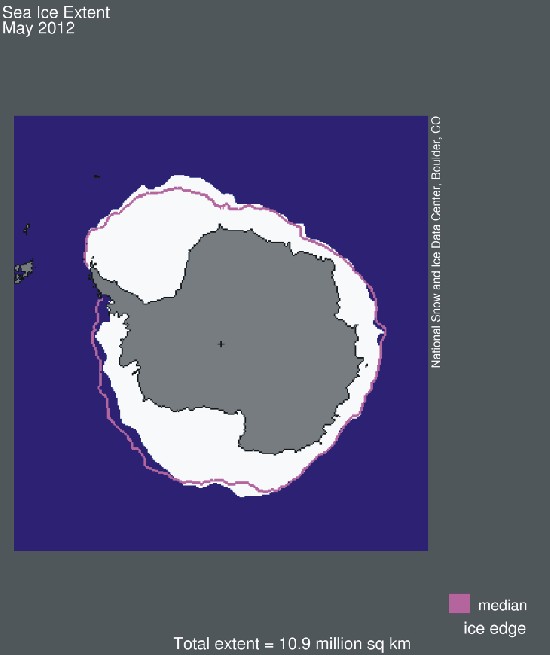
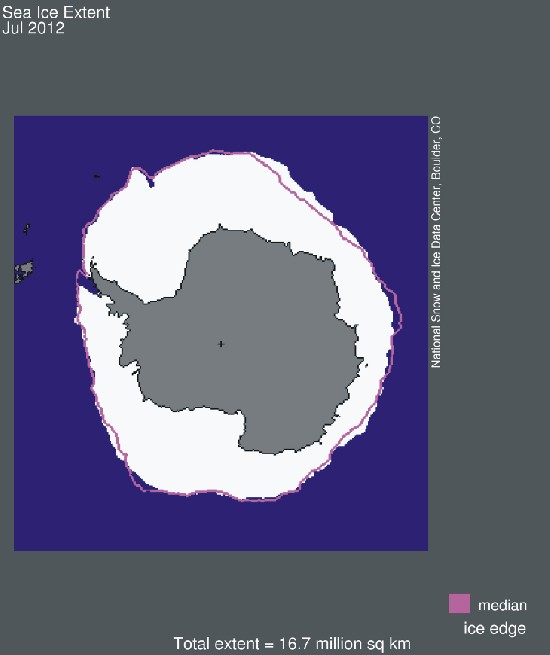
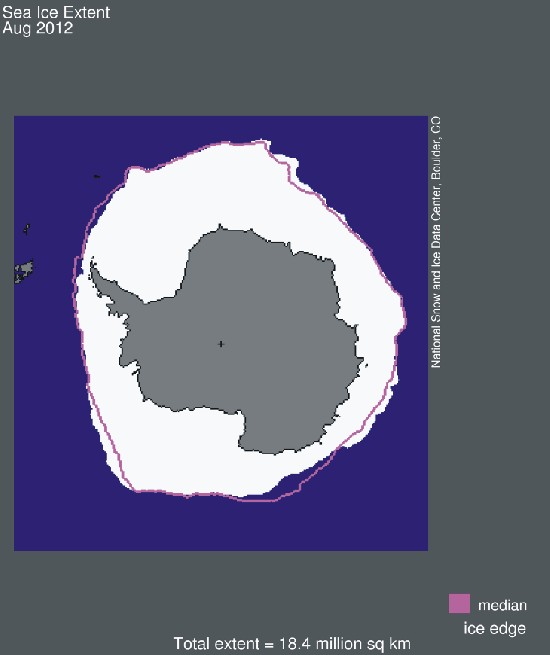
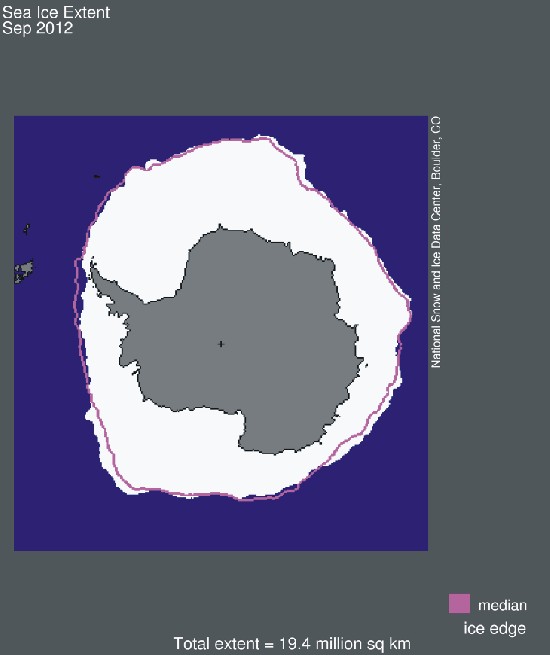
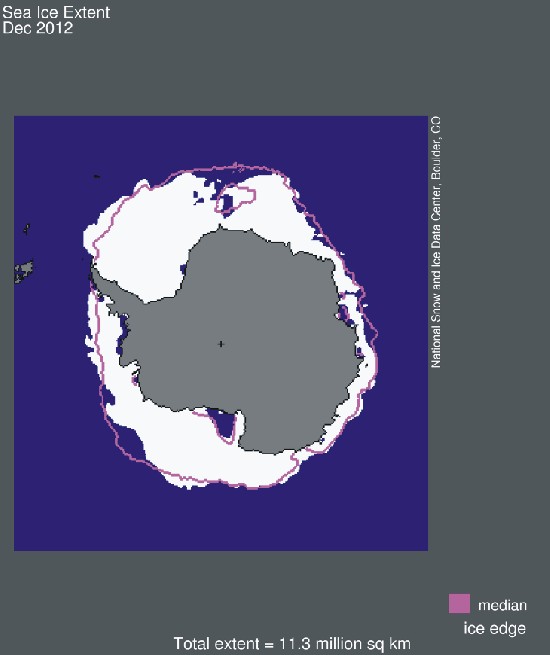
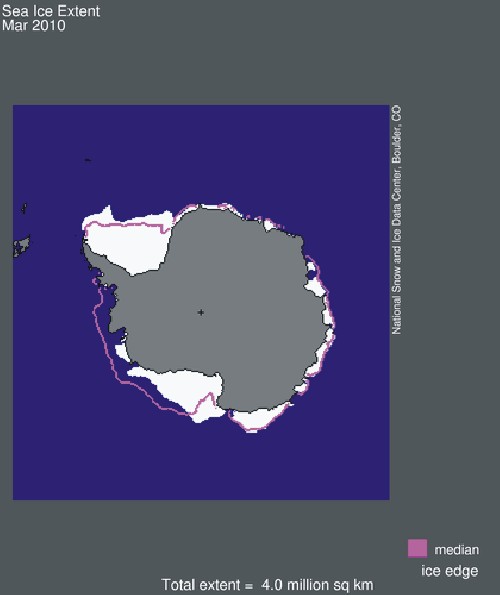
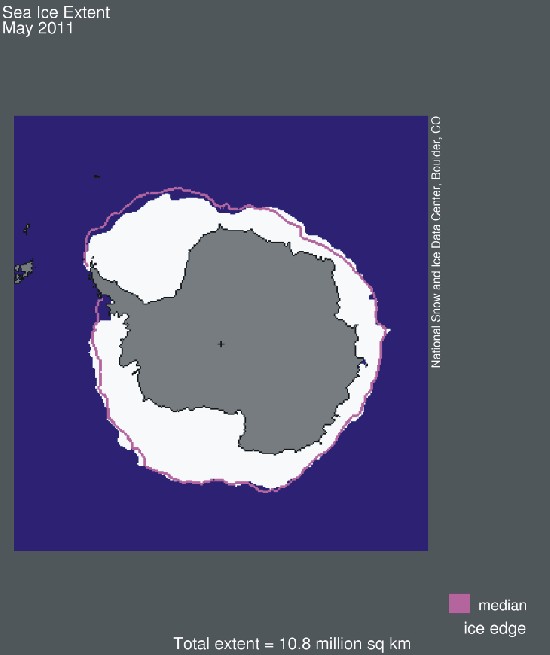
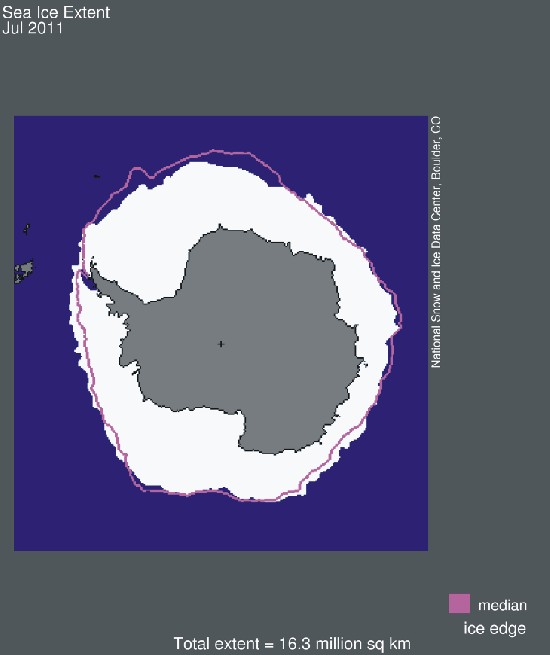
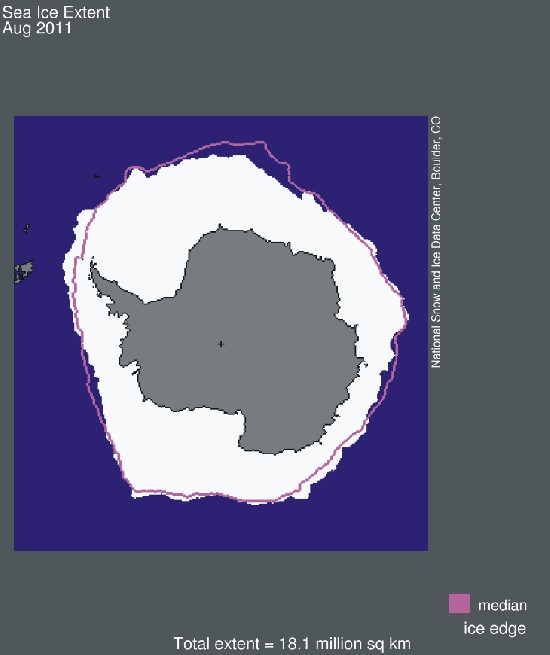
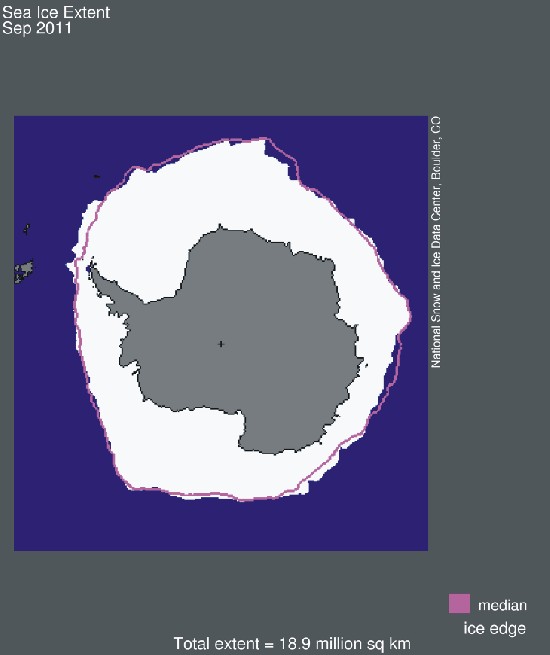
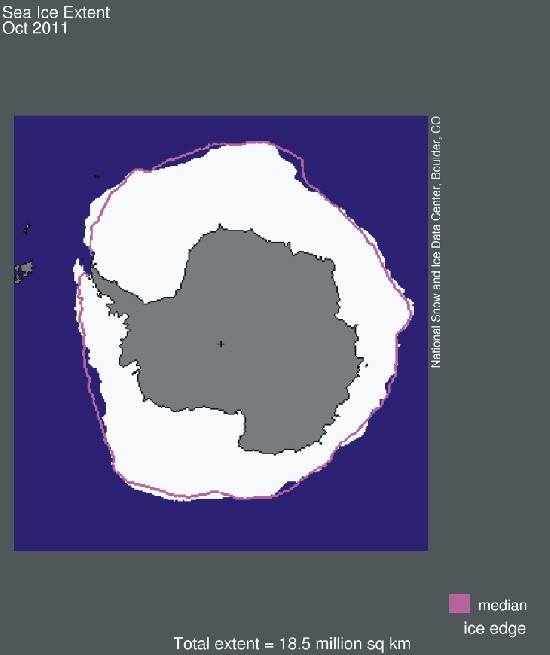
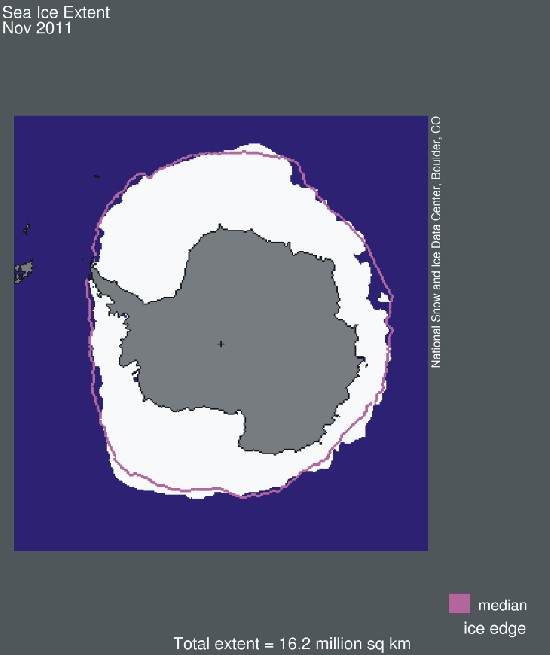
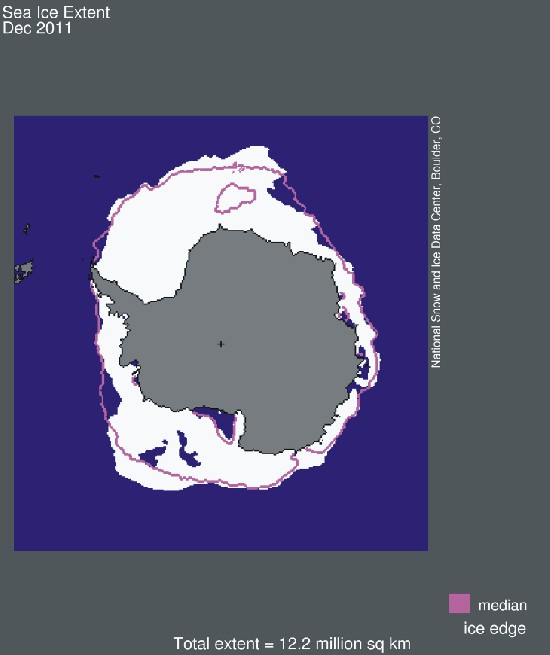
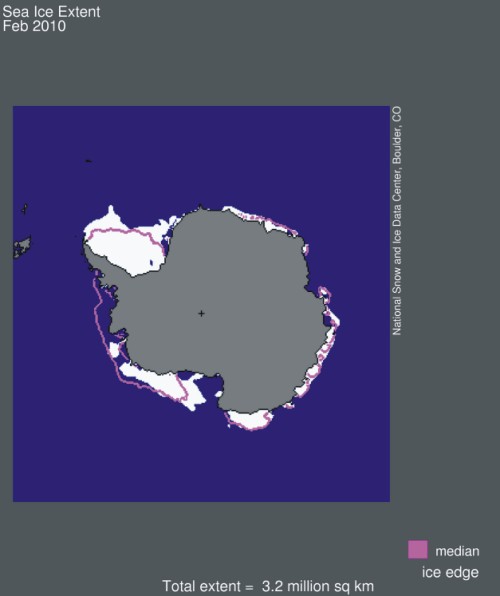
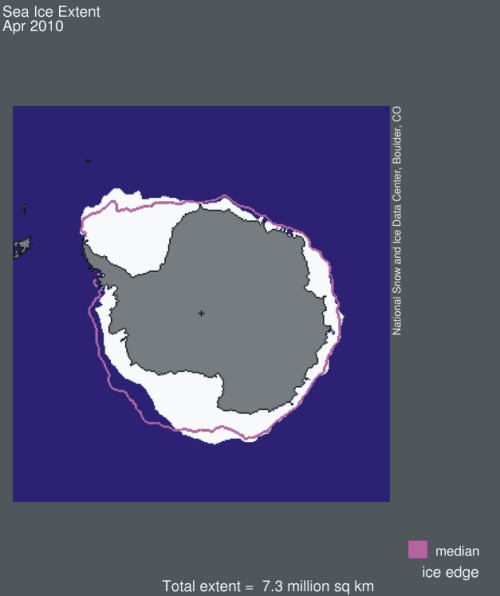
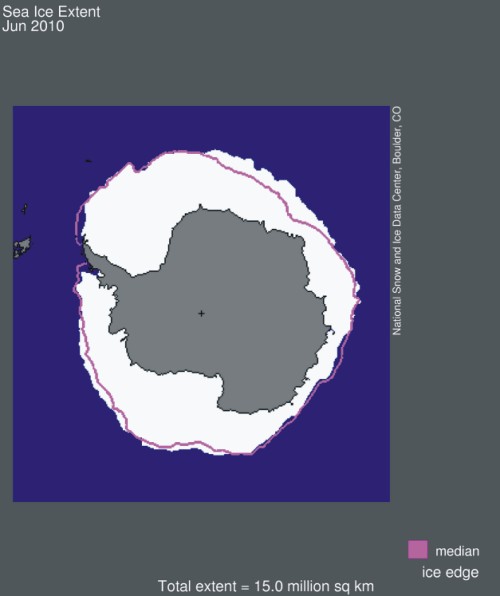
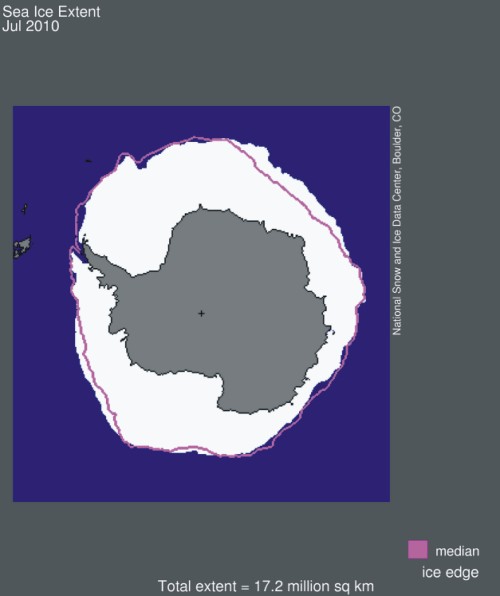
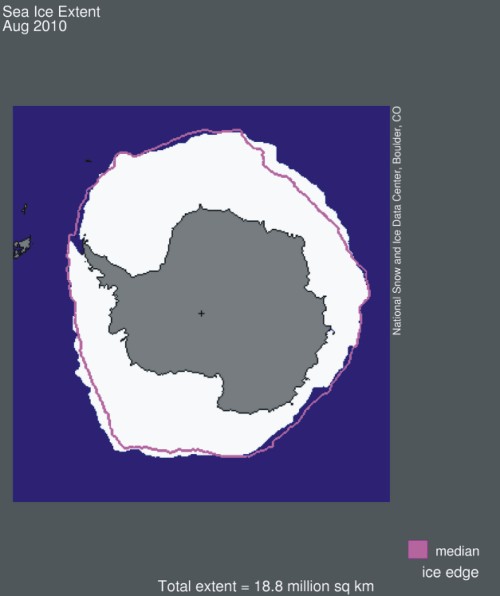
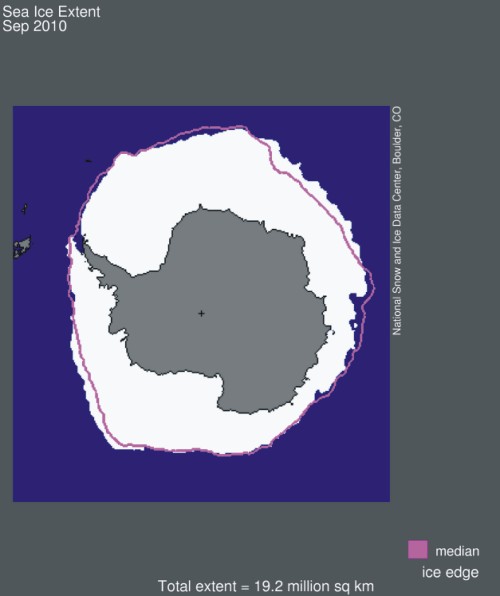
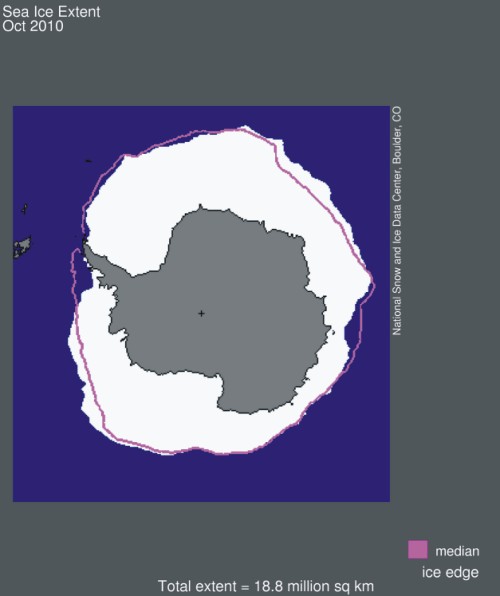
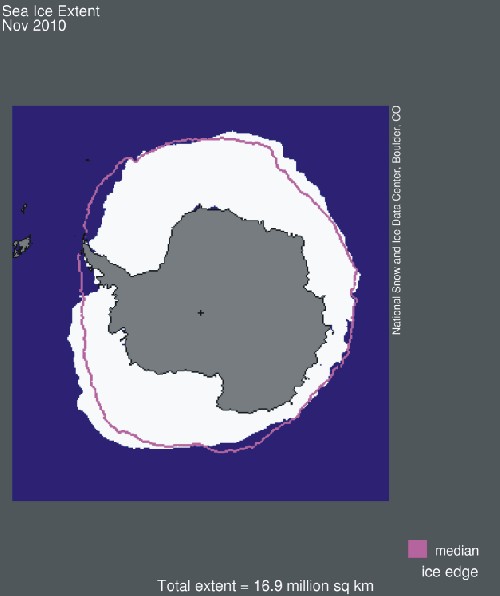
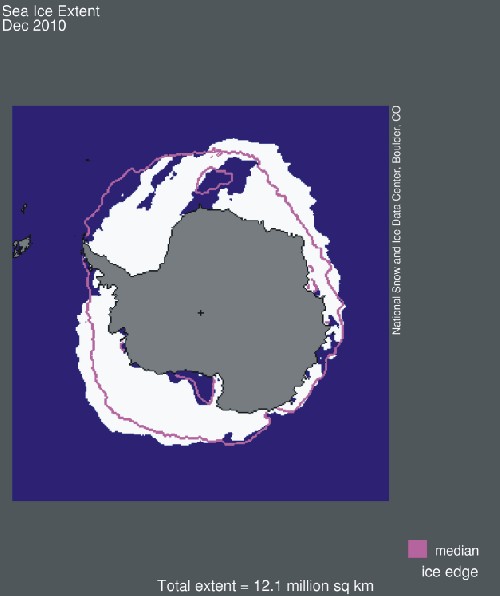
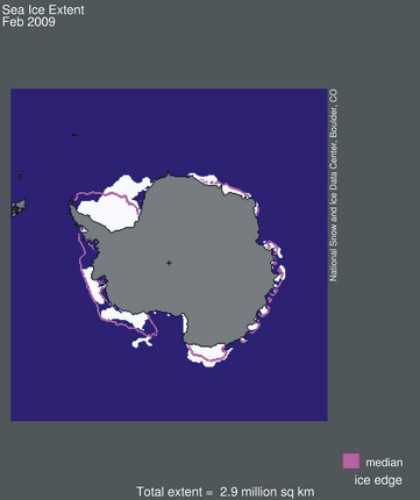
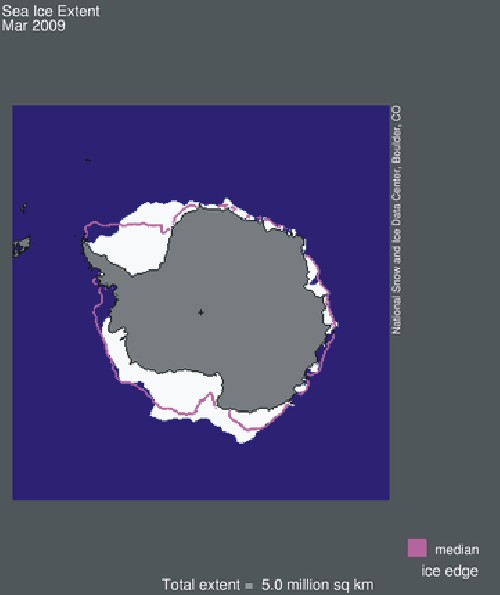
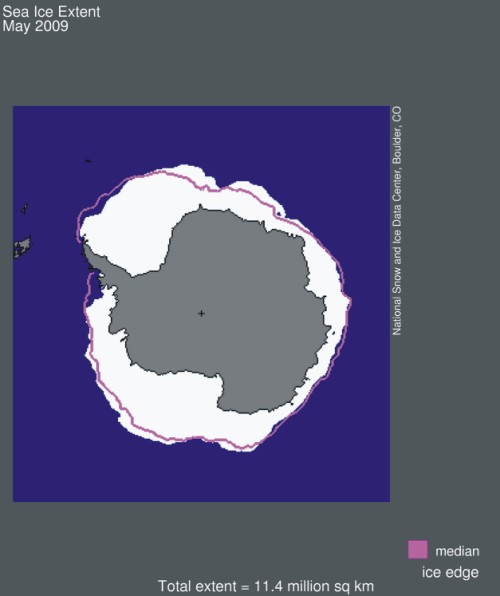
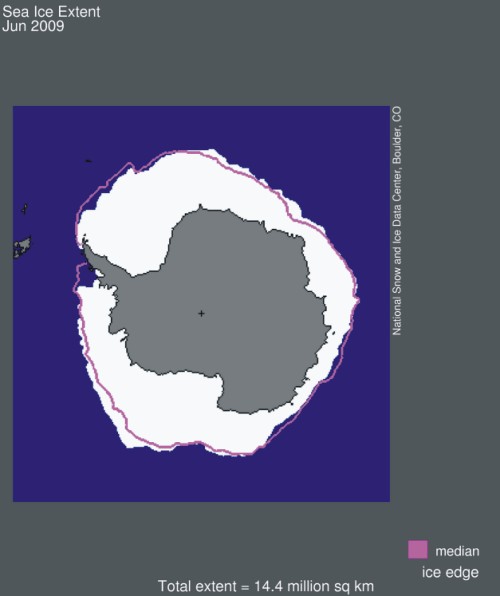
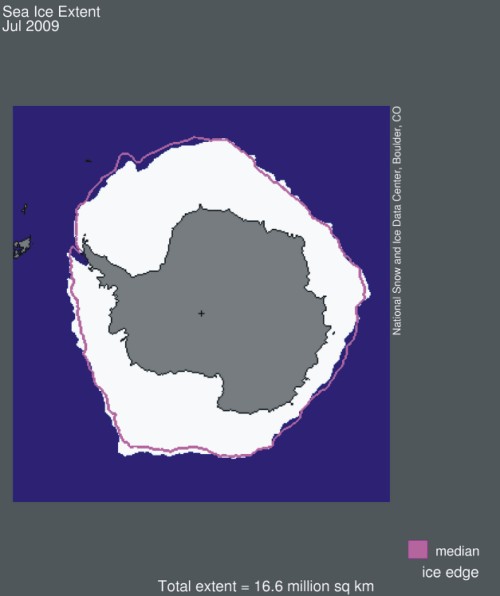
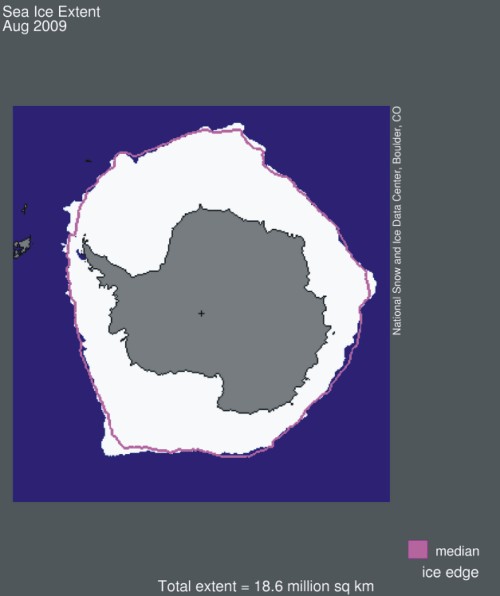
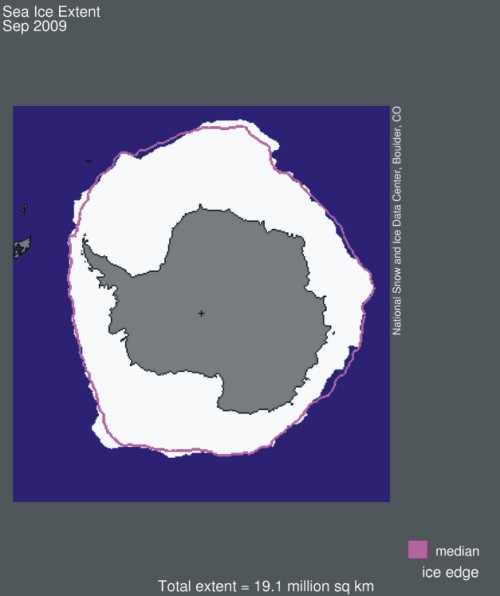
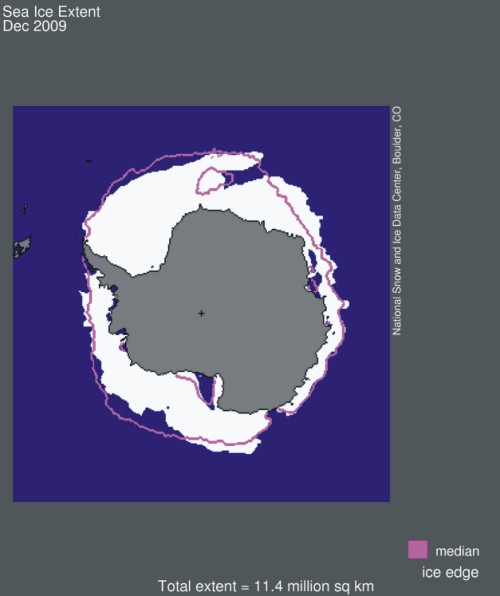
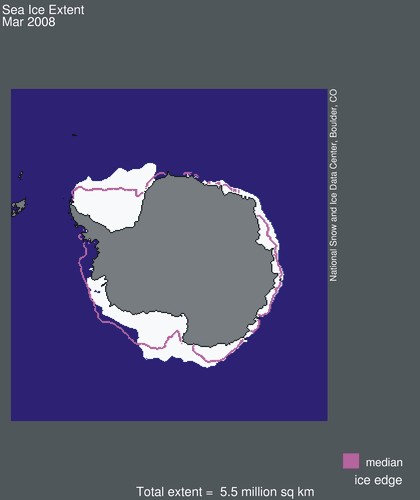
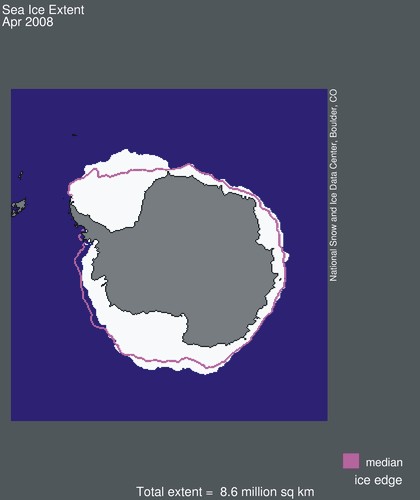
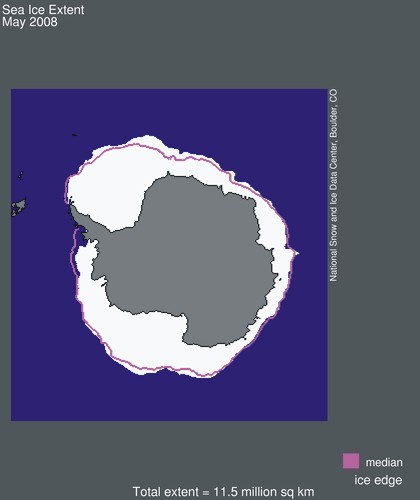
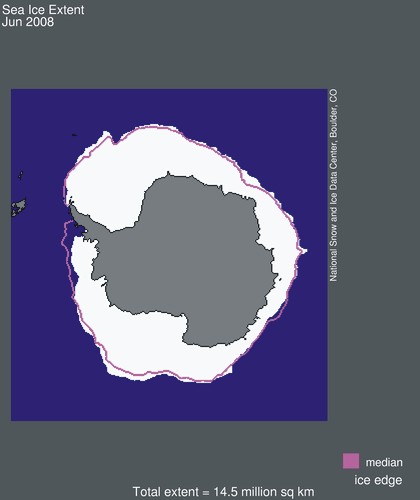
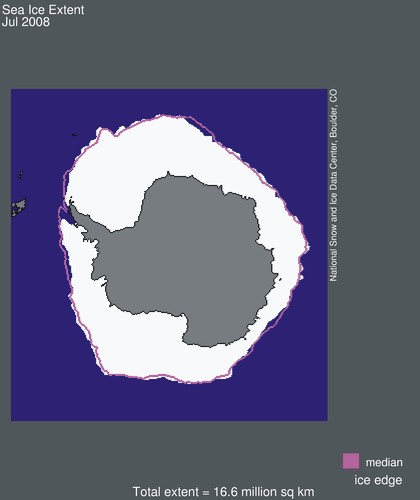
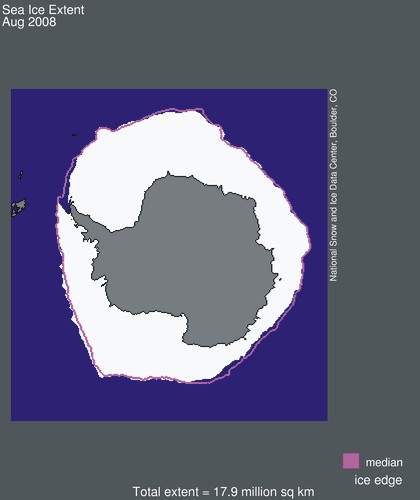
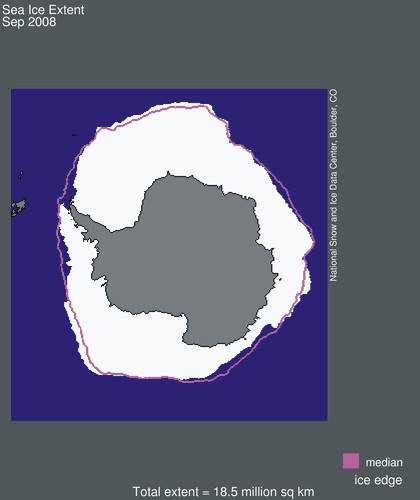
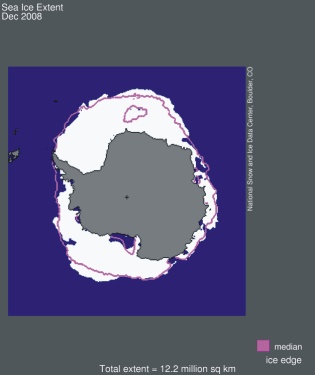
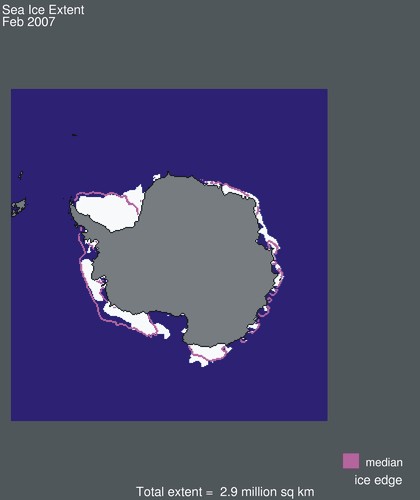
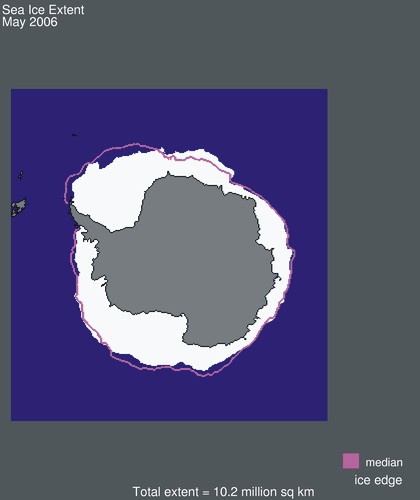
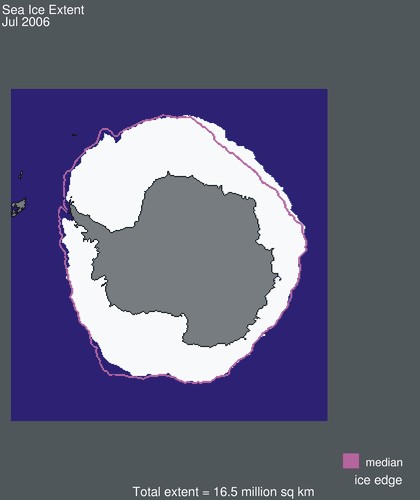
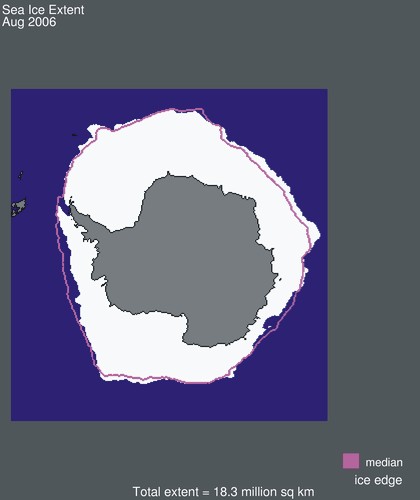
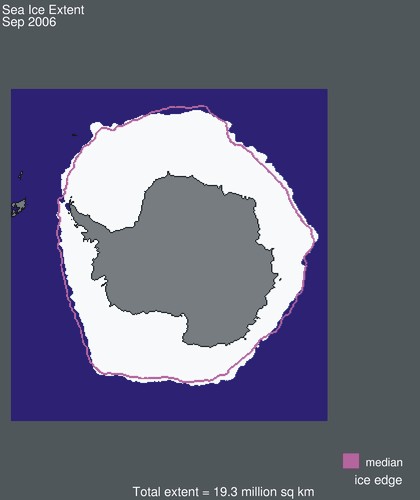
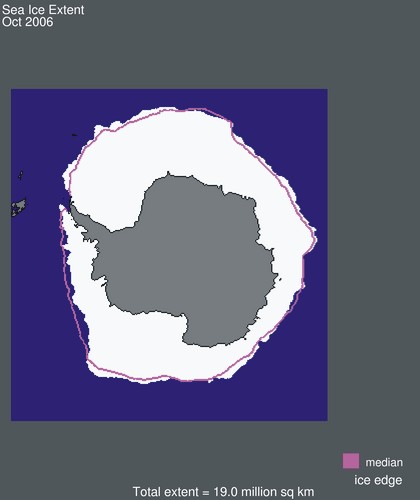
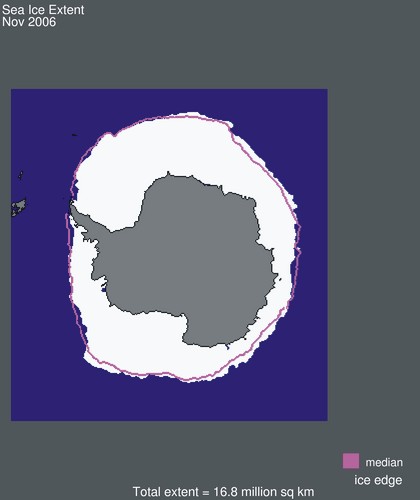
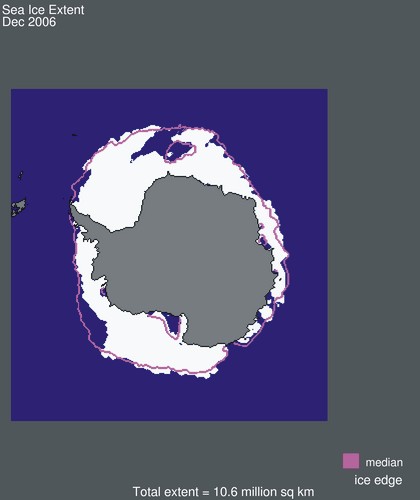
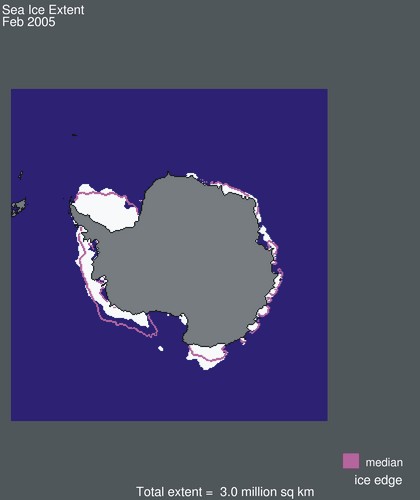
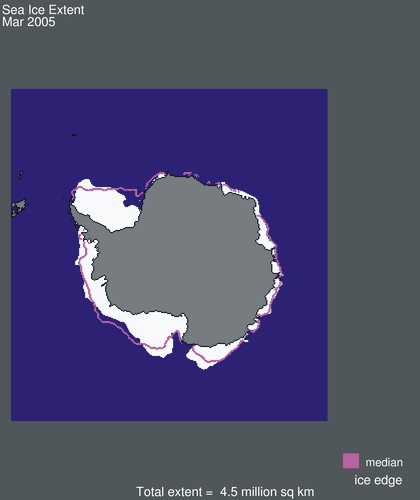
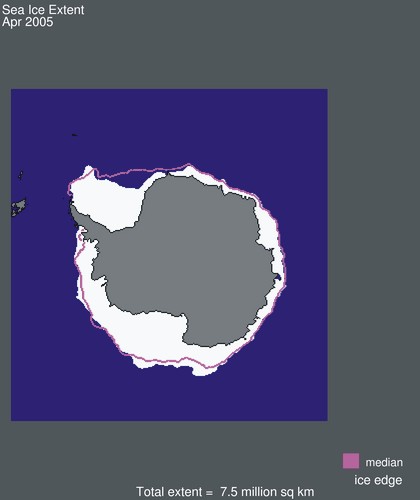
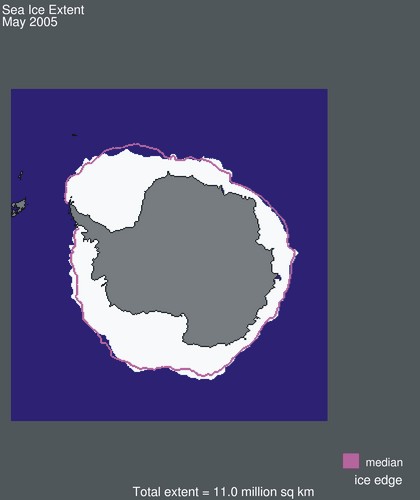
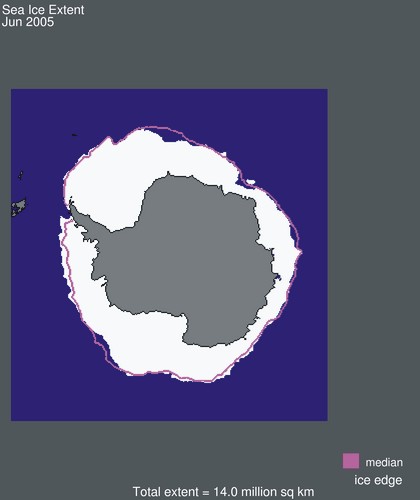
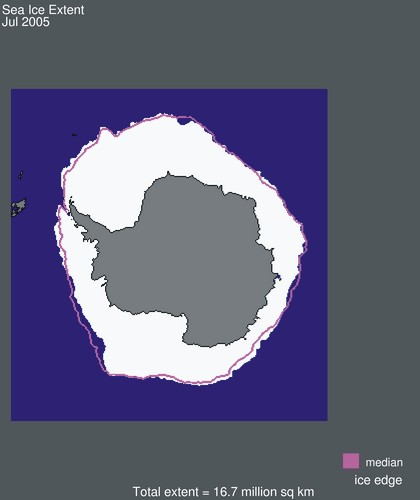
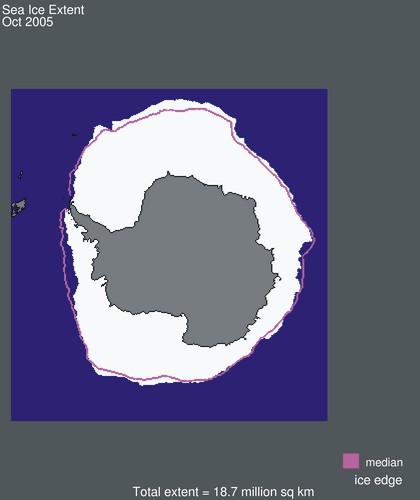
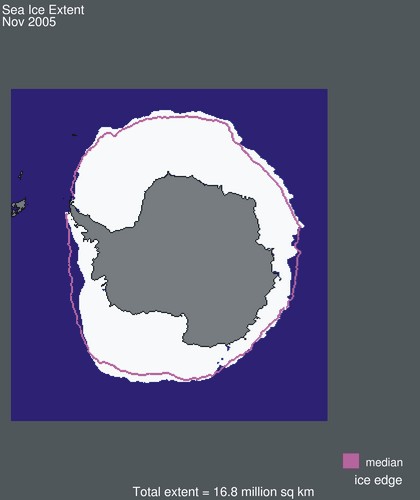
Monthly average sea ice extension in the southern hemisphere since 2005. The limit of sea ice is in this analysis defined as 15% sea ice cover, according to satellite observations. Click on the small maps to open larger sea ice map. The orange line in the large maps indicates the average monthly extension of sea ice since November 1978, according to satellite observations. Map source: National Snow and Ice Data Center (NSIDC). Please use this link if you want to see the original figures or want to check for more recent updates than shown above. A detailed analysis is also available at this site. Latest figure update: 9 April 2024.
Click here to jump back to the list of contents.
Sea ice extension in a longer time perspective
Global and hemispheric 12 month running average sea ice extension since 1979, the satellite-era. The October 1979 value represents the monthly average of November 1978 - October 1979, the November 1979 value represents the average of December 1978 - November 1979, etc. The stippled lines represent a 61-month (ca.5 years) average. Last month included in the 12-month calculations is shown to the right in the diagram. Data source: National Snow and Ice Data Center (NSIDC). Latest figure update: 9 April 2024.
-
Click here to download the monthly sea ice extension data from the National Snow and Ice Data Center (NSIDC).
March sea ice changes (%) in both hemispheres since 1979, the satellite-era. Diagram source: National Snow and Ice Data Center (NSIDC). Please use this link if you want to see the original diagrams or want to check for more recent updates than shown above. Latest figure update: 9 April 2024.
-
Please note that the changes shown are in % of the 1979-2000 mean extension. Changes in absolute values are shown in the figure below.
March sea ice changes (absolute values) in both hemispheres since 1979, the satellite-era. Diagram source: National Snow and Ice Data Center (NSIDC). Latest figure update: 9 April 2024.
-
Click here to download the monthly sea ice extension data from the National Snow and Ice Data Center (NSIDC).
Graphs showing monthly Antarctic, Arctic and global sea ice extent since November 1978. The area covered by sea ice is defined as having at least 15% sea ice cover. Thin blue lines show monthly values, and thick blue lines show the simple running 13 month average. The red lines show the 1979-2023 average. Data kindly provided by the National Snow and Ice Data Center (NSIDC). Last month shown: March 2024. Latest figure update: 9 April 2024.
-
Click here to download the monthly sea ice extension data from the National Snow and Ice Data Center (NSIDC).
-
Click here to open larger version of the diagram above.
Graph showing monthly global sea ice extent since January 2000. The area covered by sea ice is defined as having at least 15% sea ice cover. Thin blue line shows monthly values, and the thick blue line shows the simple running 13 month average. The red lines show the 1979-2023 average. Data kindly provided by the National Snow and Ice Data Center (NSIDC). Last month shown: March 2024. Latest figure update: 9 April 2024.
-
Click here to download the monthly sea ice extension data from the National Snow and Ice Data Center (NSIDC).
Graph showing monthly Antarctic sea ice extent since January 2000. The area covered by sea ice is defined as having at least 15% sea ice cover. Thin blue line shows monthly values, and the thick blue line shows the simple running 13 month average. The red lines show the 1979-2023 average. Data kindly provided by the National Snow and Ice Data Center (NSIDC). Last month shown: March 2024. Latest figure update: 9 April 2024.
-
Click here to download the monthly sea ice extension data from the National Snow and Ice Data Center (NSIDC).
Graph showing monthly Arctic sea ice extent since January 2000. The area covered by sea ice is defined as having at least 15% sea ice cover. Thin blue line shows monthly values, and the thick blue line shows the simple running 13 month average. The red lines show the 1979-2023 average. Data kindly provided by the National Snow and Ice Data Center (NSIDC). Last month shown: March 2024. Latest figure update: 9 April 2024.
-
Click here to download the monthly sea ice extension data from the National Snow and Ice Data Center (NSIDC).
The extension of all Arctic and Antarctic sea ice has only been monitored in a systematic way since the onset of satellite observations in late 1978, as shown in the diagram above. Before November 1978 observations were more local and regional, and many of the overall details are not known. As an example, the tragic loss of Hans Hedtoft in 1959 became the stimulus to initiate Danish airborne observations of sea ice around southern Greenland.
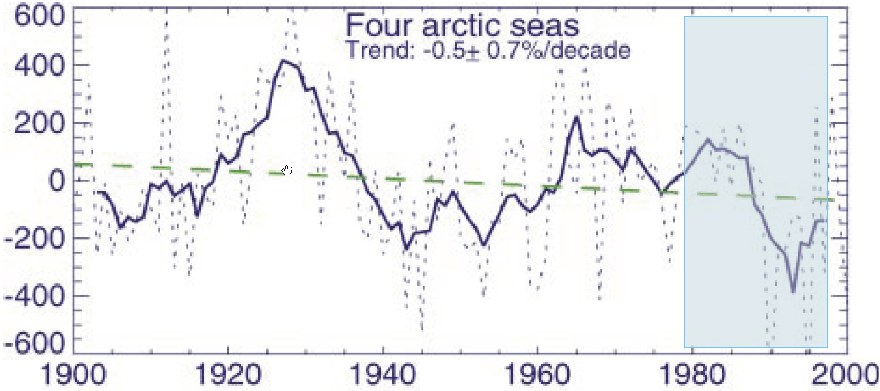
Time series showing the August ice-extent anomalies (x 1000 km2) in the Arctic Ocean along the coast of Russia, Siberia and Alaska: The Kara Sea, the Laptev Sea, the East Siberian Sea, and Chuckchi Sea (Polyakov et al. 2003). The composite record show large sea ice variations around a small negative trend since 1900, although the trend from a statistical point of view is not significant (Polyakov et al. 2003). The blue area to the right shows the time extent of the satellite-era shown in the figure higher up in this paragraph.
To
obtain knowledge on Arctic sea ice extent in a longer time perspective, Polyakov
et al. (2003) analysed the Russian historical records of Arctic sea ice
extent and thickness extend back to the beginning of the twentieth century.
Occasional ship observations of summer ice edge started in the first decade of
the 1900s when the first Russian hydrographic surveys and commercial shipping
routes along the Siberian coast began. Starting in 1929, when the Soviet Polar
Aircraft Fleet was created, aircraft-based observations began, which improved
the quality of the data substantially. However, systematic aircraft and ship
observations of sea ice from the
Based
on these observational data, Polyakov et al.
(2003) concluded that the “examination of records of fast ice thickness
and ice extent from four Arctic marginal seas (Kara, Laptev, East Siberian, and
Chukchi) indicates that long-term trends are small and generally statistically
insignificant, while trends for shorter records are not indicative of the
long-term tendencies due to strong low-frequency variability in these time
series, which places a strong limitation on our ability to resolve long-term
trends”. “Correlation analysis shows that dynamical forcing (wind or surface
currents) is at least of the same order of importance as thermodynamical forcing
for the ice extent variability in the Laptev, East Siberian, and
Figure 2 in Vinje (2001), showing the reduction in April sea ice extent in the Nordic Seas since 1864. Nordic Seas (NS), eastern area (E), and western area (W) time series given by 2-yr running mean and regression lines. Linear year-to-year interpolations of the ice extent have been made for the western area for 1940 and 1944–46, and for the eastern area for 1868–70, 1874–78, 1880, 1892, 1894, 1940–41, 1943–48, and 1961. The blue area to the right shows the time extent of the satellite-era shown in the figure higher up in this paragraph. Apparently, much of the sea ice reduction in this region occurs in concert with the termination of the Little Ice Age and the following warming during the 20th century. Click here to read a few reflections on this overall theme.
For sea ice in the Nordic Seas the Norwegian scientist Torgny Vinje (Vinje 2001) has done the painstaking work of collecting observations made by ships since 1864. In the Nordic Seas the maximum extent of ice (April, se diagram above) has decreased around 33% since 1864, demonstrating that the reduction is not a new phenomena, but began long ago. Nearly half the observed reduction actually took place between 1860 and 1900 (Vinje 2001). While the mean annual reduction of the April ice extent has been decelerating by a factor of 3 between 1880 and 1980, the mean annual reduction of the minimum (August) ice extent is proceeding linearly (Vinje 2001).
The map below show maximum (April) sea ice extension in the Atlantic sector of the Arctic, acording to the sea ice database established at the Norwegian Polar Institute by Torgny Vinje.
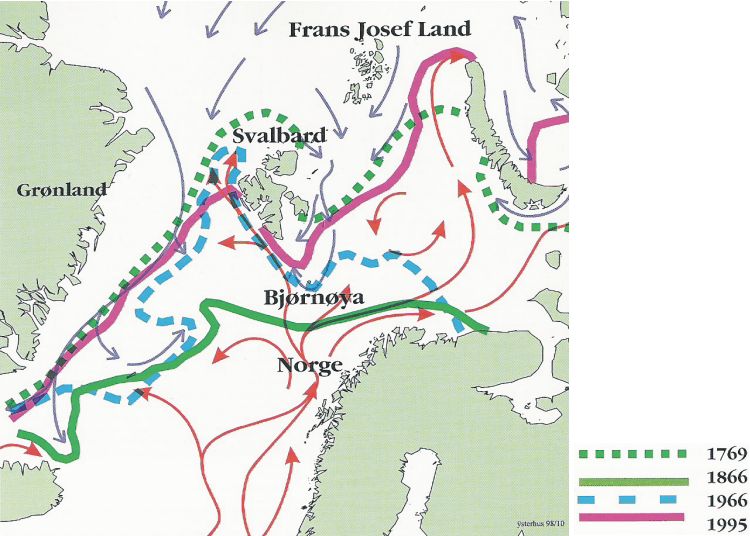
Map showing maximum (April) sea ice extension in the Atlantic sector of the Arctic (Norwegian Polar Institute 2000). The map is based on a database on sea ice extension in the area shown during the past 400 years, to a high degree based on written records found in ships logbooks.
Click here to jump back to the list of contents.
Sea ice occupies about 7% of
the surface area of planet Earth. The sea ice thickness, its spatial extent, and the
fraction of open water within the ice pack can vary rapidly and profoundly in
response to weather and climate. Sea ice typically covers about 14 to 16 million
square kilometres in late winter in the
Sea ice variations have recently attracted much public interest. Part of the reason for this is the high albedo (c. 80%) of sea ice, which reflects much of the incoming solar short-wave radiation during the summer time. If not reflected, this radiation may instead be consumed by warming ocean water, thereby initiating a positive feedback, leading to more warming. This simple analysis however ignores that evaporation will increase from the ocean when the total sea icecover are reduced in size. Increased evaporation usually results in an increased cloud cover and increased reflectance of incoming solar radiation, which tend to counteract the above process. The decrease or increase of sea ice has no effect on the global sea level.
The sea ice maps shown above are reproduced by courtesy of National Snow and Ice Data Center (NSIDC). Additional sea ice diagrams and analyses can be studied on this web site.
Click here to jump back to the list of contents.
Passive microwave remote sensing instruments
The
sea ice maps above are produced by Scientists
at the Goddard Space Flight Center, USA, by combining combined the SMMR and SSM/I
data sets to provide a time series of sea ice data spanning over 30 years in
total. NASA
launched the Scanning Multichannel Microwave Radiometer (SMMR) in 1978, and the
Defense Meteorological Satellite Program (DMSP) launched the first of the
Special Sensor Microwave/Imager (SSM/I) sensors in 1987 (Fetterer
et al. 2002).
Click here to jump back to the list of contents.
-
University of Bremen, Germany
Click here to jump back to the list of contents.