Climate and landscapes
Open Climate4you homepage
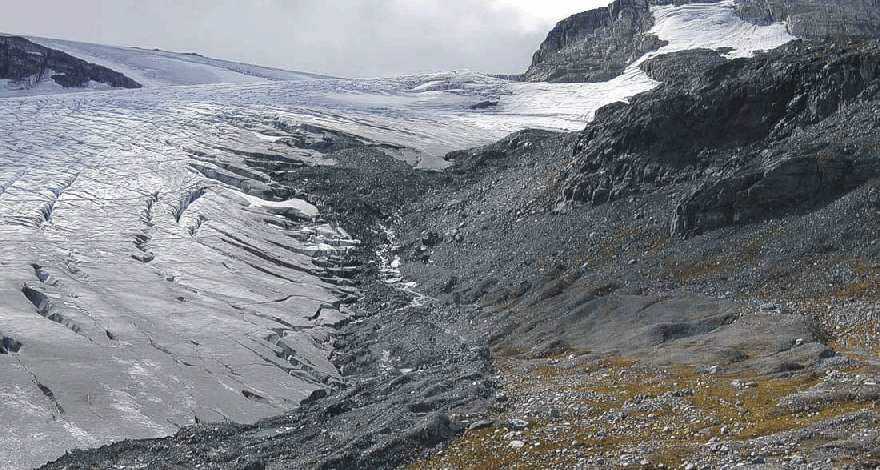
Middalsbreen, an outlet glacier from the 74 km2 ice cap Hardangerjøkulen in southern central Norway, August 30, 2003. Shortly to the right a fresh moraine system is seen, still without vegetation. This is the result of a glacier advance during the 1990's, not caused by lower temperature, but higher winter precipitation. Further to the right another moraine system is seen, the result of another glacier advance during the 1970's, mainly caused by somewhat lower air temperature during the summer.
The relationship of landforms and landscapes to climate is a topic which has simultaneously been regarded as an important focus for geomorphological research, and an approach which has fruitlessly occupied the time of other geomorphologists over the past several decades. The former view has characterised research by many German and French geomorphologists, whereas the latter has prevailed among many Anglo-American researchers. There is little, doubt, however, that a number of processes and landforms associated with fluvial, eolian, glacial and periglacial environments clearly demonstrate that major differences in climate have a profound effect on landscape development. In addition, any landscape is seen to reflect ongoing climatic changes, at least in a number of the minor landforms. By this, any landscape will tend to represent an archive over past and present climatic changes.
Landscapes and geomorphology are, however, not only passive archives of past and present climatic variations. In various ways they interact with climate itself. Geomorphological activity may lead to changes in surface albedo, e.g. by a change in vegetation or by the advance or retreat of glaciers. By volcanic eruptions, greenhouse gasses like water vapour and CO2 is released to the atmosphere. In addition to this, material carried to the sea by rivers, or transported by glaciers or the wind, experiences some degree of chemical decomposition or physical breakdown prior to being eroded and during the subsequent transport. This is the process of weathering, which may influence upon the chemical composition of the atmosphere. Especially the process of carbonation is important in this respect, as it efficiently removes CO2 from the atmosphere. Carbonation plays a particularly important role in the weathering of calcareous rocks.
Generalised temperature diagram based on temperature measurements in the Greenland Ice Sheet (Dahl-Jensen et al. 1998), annotated with a number of historical events around the North Atlantic. MAAT is short for mean annual air temperature. Some of the text in the diagram contains links to additional information.
Click here to jump back to the list of contents.
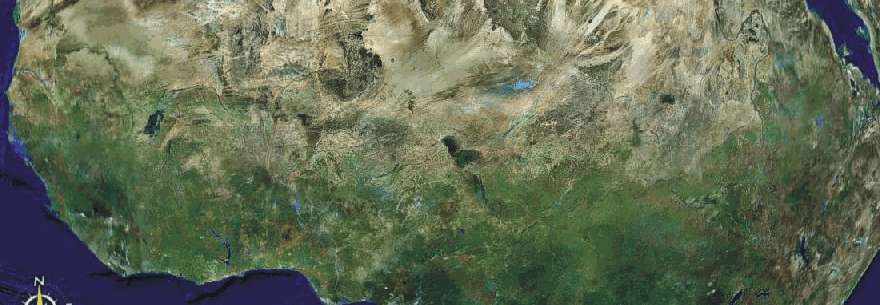
The Sahel region in North Africa. Lake Chad is the dark region near the center of the picture. The area shown covers about 7000 km from west (left) to east. Source: Google Earth.
The Sahara Desert is the most extensive desert on Earth but during the Holocene (the last 12,500 years) it was home to some of the largest freshwater lakes on Earth; of these, palaeolake Megachad was the biggest. The present lake Chad is a minor rest. Landsat TM images and Shuttle Radar Topography Mission (SRTM) digital topographic data reveal numerous shorelines indicating the former outline of the much bigger Lake Megachad (Drake and Bristow 2006). At its peak sometime before 7000 years ago the lake was over 173 m deep with an area of at least 360,000 km2, bigger than the Caspian Sea, which is the biggest lake on Earth today. The morphology of the shorelines indicates two dominant wind systems, one from northeasterly direction, consistent with the present-day winds in the region. The other originated from the southwest. These old coastal features today found in Sahara can be attributed to an enhanced monsoon caused by a precessionally driven increase in Northern Hemisphere insolation at that time, leading to high global temperatures. Subsequent desiccation of the palaeolake is recorded by numerous regressive shorelines in the Sahara Desert.
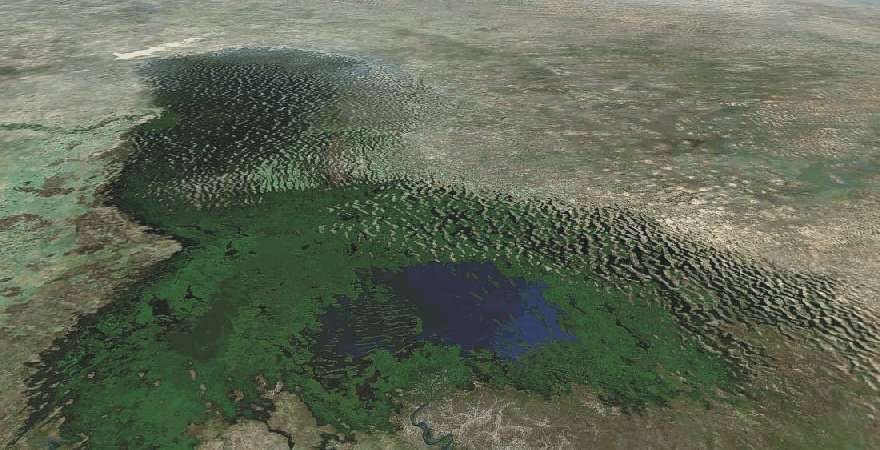
Lake Chad seen from SSE. The bright pattern visible in the green (vegetation covered) areas are old sand dunes, signalling a previous drier period than now, with dominance of northeasterly winds. The dark blue area is the modern lake Chad, having a surface area of about 1350 km2, comparable to the land area of the Faeroe Islands in the North Atlantic. The maximum water depth is small, only about 11 m. Source Google Earth.
Lake Chad is a shallow lake in northern central Africa, known to vary in size over the centuries. It is economically important for the region, providing water to more than 20 million people living in the four countries which surround it, Chad, Cameroon, Niger and Nigeria. It is located in the western part of Chad, bordering on northeastern Nigeria. The Chari River is the main source of water, providing over 90% of Lake Chad's water, and draining from the mountains farther east in western Sudan. Lake Chad possesses many small islands and mudbanks, and its shorelines are largely composed of marshes. Because it is very shallow (maximum depth c. 11 m) its surface area is very sensitive to small changes in climate, affecting inflow and evaporation. Lake Chad has no clear outlet. It was one of the largest lakes in the world when first surveyed by Europeans in 1823, but it has shrunk considerably since then. An increased demand on the lake's water from the local population has likely accelerated its shrinkage over the past 40 years. The lake presently has an average depth of only 1.5 meters. It apparently nearly dried out in 1908 and again in 1984.
The modern Lake Chad is a remnant of the former inland sea Lake Megachad (Drake and Bristow 2006), which has grown and shrunk in concert with climatic changes during the Holocene (last 12,500 years). At its largest, around 7000 years ago, this lake is estimated to have covered an area of about 360,000 km2.
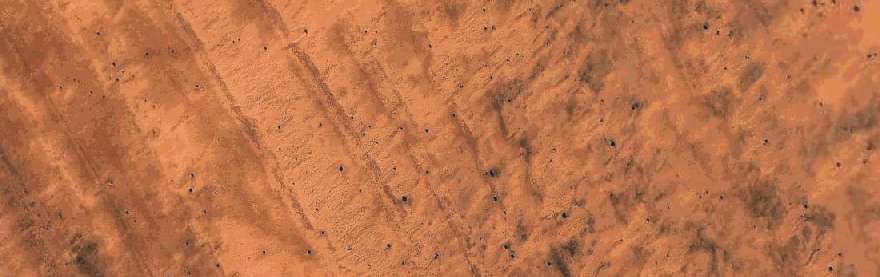
Old beach ridges (15.55oN, 18.69oE) in southern Sahara, created at the shore of former Lake Megachad. North is up. The wave action (and wind) was from southwest. Today the beach ridges are partly covered by sand dunes moving with the northeasterly winds. The picture measures about 3 km across from west (left) to east. Source: Google Earth.
Inspection of Landsat TM imagery (Drake and Bristow 2006) clearly reveals a wide array of coastal landforms in the Chad Basin including beach ridges, spits, cuspate forelands and deltas that were formed around palaeolake Megachad. The evidence of wave action preserved in the coastal landforms is attributed to a combination of northeasterly and southwesterly winds.
The winds appear to have been seasonal with northeasterly winds in the winter and southwesterly winds due to an enhanced monsoon in the summer. Enhancement of the southwesterly monsoon is important because it contributed to increased rainfall in the Chad basin and to the filling of palaeolake Megachad. Geomorphological evidence from old deltas indicates subsequent drying from the north. Palaeoshorelines have been traced around the lake and found at similar altitudes even when separated by thousands of kilometres. At its maximum extent Lake Megachad was larger than any lake that exists on Earth today. At around 7500-6950 years before now it was 360,000 km2; by 4000 years before now it had shrunk even further and split into three separate lakes, Lake Chad, Lake Fitri and Lake Bodele. As the catchment of Lake Megachad adjoins that of other large lakes to the north it is possible that these lakes provided a humid corridor across the Sahara that would not have existed had the Sahara not been dominated by large closed basins. Such a corridor may have implications for palaeoanthropology and biogeography as the Sahara is thought to provide a barrier to the movement of hominids and animals out of Africa.
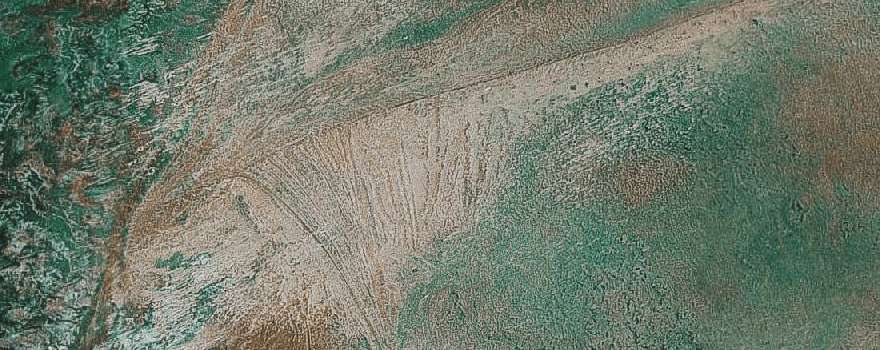
Cuspate foreland (15.72oN, 18.75oE) consisting of several systems of beach ridges at the former shore of Megalake Chad, about 500 km NE of the present Lake Chad. North is up. The two main coastlines meeting in the cuspate foreland was controlled by winds from NE and SW, respectively. The picture measures about 15 across from west (left) to east. Source: Google Earth.
Click here to jump back to the list of contents.
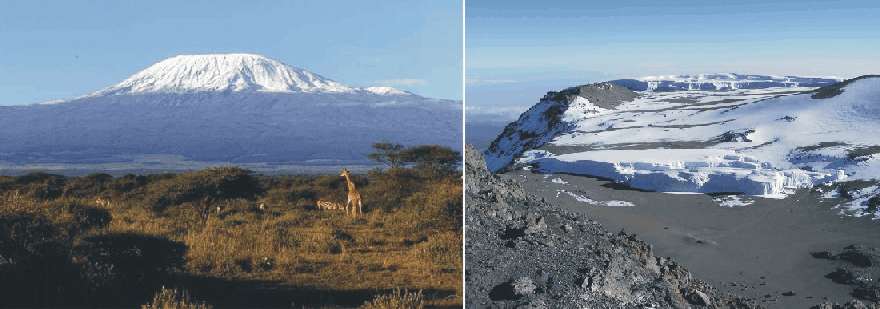
The stratovolcano Kilimanjaro (5895 m asl.) in northeastern Tanzania (left). The Furtwängler Glacier on the summit plateau of Kilimanjaro (right). The vertical ice cliffs are about 40 m high.
Kilimanjaro (5895 m
asl.) is an inactive stratovolcano in northeastern Tanzania, near the border to
Kenya
. Kilimanjaro is also the tallest
free-standing mountain in the world, rising 4,600 m from the surrounding
plains. The first official climb of the highest summit was on October 6, 1889 by
the German Hans Meyer, the Austrian Ludwig Purtscheller, guided by the Marangu
army scout Yohanas Kinyala.
The
glaciers on Kilimanjaro have attracted much recent interest, especially in
relation to global temperature changes. The Furtwängler Glacier (see illustration above) is located near the
summit, and is a remnant of a bigger icecap which once crowned the summit of
A detailed analysis of six ice cores retrieved from the ice fields on the summit of Kilimanjaro shows that those glaciers began forming about 11,700 years ago (Thompson et al. 2002). The ice core records from the Furtwängler Glacier suggests conditions at the Summit of Kilimanjaro today are returning to those characteristic for the site 11,000 years ago.
For decades it has been known that solar radiation and sublimation, not air temperature, are the primary factors for loss of ice from tropical glaciers. In the tropics glaciers exist only at the highest elevations, and their size is controlled more by seasonal changes in precipitation than by air temperatures. Observations of the volume change of glaciers on Kilimanjaro suggest their total volume had already decreased by 66 percent from 1889 to 1953.
The balance between energy inputs and energy outputs are important to understand 20th century glacier reduction at Kilimanjaro. The primary input of energy is short-wave solar radiation, while ice loss is primarily by way of sublimation, the transition of ice directly to water vapor. Because neither solar radiation and sublimation depends primarily on surface air temperatures, air temperature change does not have a big role in the loss of ice from tropical glaciers. That this also applies to glaciers on Kilimanjaro can be seen from the fact that the ice on Kilimanjaro forms high vertical walls (see illustration above) and finger-like features called penitents (see illustration below), the result of sublimation driven by direct radiation from the sun, rather than ablation caused by warm air.
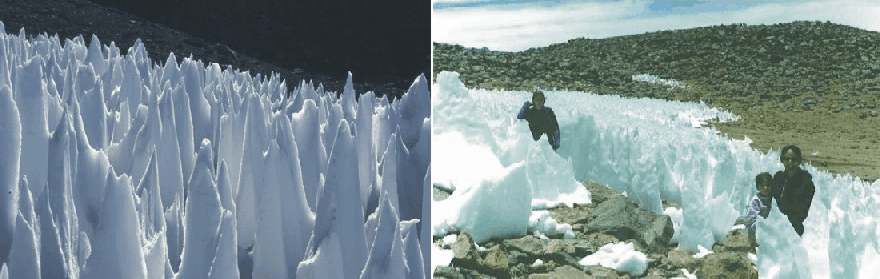
Examples of ice and snow
penitentes from tropical areas. The individual blades are between 1.5 and 2m in height, but may be as high
as several meters. Because penitentes are formed by sublimation driven by direct
solar radiation, their axis indicate the approximate position of the sun at noon
at this latitude and time of the year.
A
prolonged dry period may be responsible for the shrinking glaciers on
Kilimanjaro.
Kaser et al (2004) found that a marked drop in
atmospheric moisture at the end of the 19th century and the ensuing drier
climatic conditions are likely to represent the main driver for 20th century
glacier retreat on Kilimanjaro. Independent
surface observations of water levels from nearby
The ice core from from
the Furtwängler Glacier
(Thompson et al. 2002) yield evidence
of three catastrophic droughts in the tropics 8,300, 5,200 and 4,000 years ago.
The ice core also suggest a much wetter environment near Kilimanjaro 9,500 years
ago, contemporary with the existence of the large Megalake Chad (see
above). The ice core also showed a 500-year period beginning around 8,300
years ago when methane levels in the ice dropped rapidly, suggesting that
several lakes of
In addition, the ice core showed
an abrupt depletion in oxygen-18 isotopes that may signal a second drought event
occurring around 5,200 years ago (Thompson et al.
2002). This coincides with the period when anthropologists believe people in
the region began to come together to form cities and social structures. Prior to
this, the population of mainly hunters and gatherers had been more scattered. A
third marker type in the ice cores is a visible dust layer dating back to about
4,000 years ago (Thompson et al. 2002). This
is interpreted as marking a severe 300-year drought which struck the region.
Historical records show that a massive drought hit the Egyptian empire at the
time and threatened the rule of the Pharaohs. Until this time, people in
Click here to jump back to the list of contents.
Glacier growth during the last 1100 years on Spitsbergen, Svalbard

Map showing part of the Arctic, with Svalbard in the center.
Within the High
Arctic, high climatic sensitivity applies to the Archipelago of Svalbard (77-80oN),
located on the boundary between the
The
climatic sensitivity of the
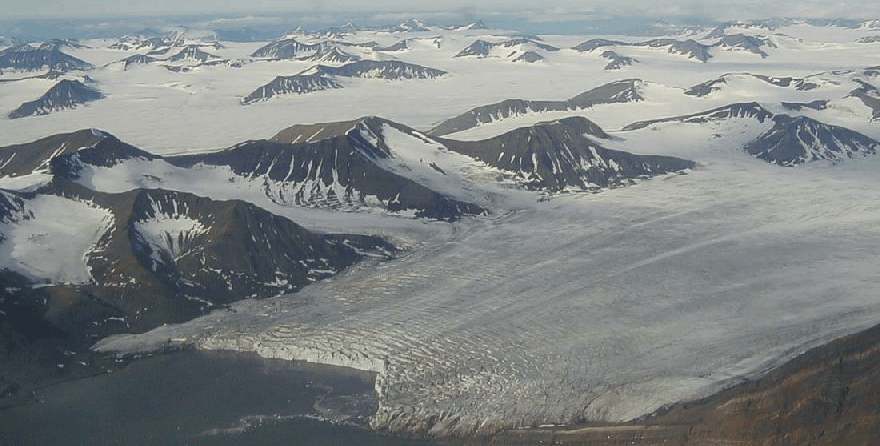
Wahlenbergbreen, central Spitsbergen, July 24, 2000.
Glaciers presently cover about 60 percent of
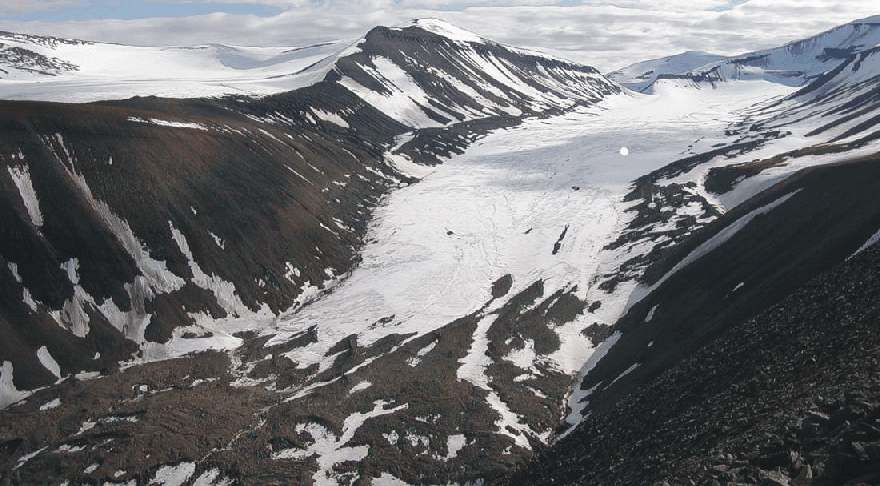
Longyearbreen, central Spitsbergen, July 6, 2003, looking south. The site where plants was found below the glacier is indicated by a white spot. The lowermost part of the glacier is covered by debris. The glacier is about 5 km in length.
Longyearbreen
(3.2 km2) is about 5 km long and flows from a large cirque at the
head of the valley Longyeardalen (Humlum
et al. 2005), see photo above.
Surging glaciers are frequent on
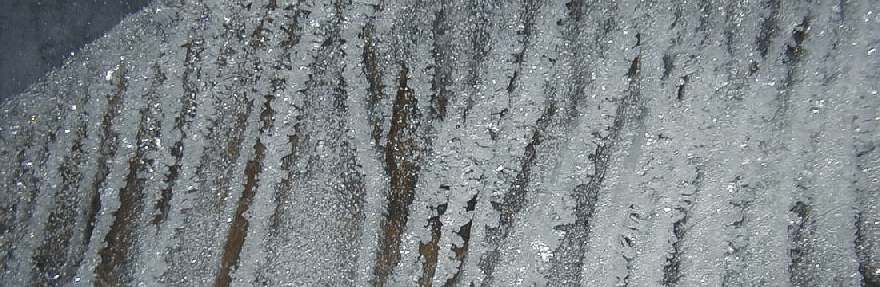
Ice
formations in ice cave below Longyearbreen, May 10, 2002. The section shown is
about 1 m high.
Below
the equilibrium line crevasses are narrow and few. Perennial supraglacial
meandering meltwater channels erode into the glacier surface each summer. When
such channels reach a depth of 8-12 m, ice deformation slowly closes the upper
part of the channels. Thus, the channels are gradually transformed into
englacial, meandering tunnels. A number of these meltwater conduits have now
reached the glacier bed 20-50 m below the surface, exposing the glacier-bed
interface for considerable distances along their course. During the winter, when
water discharge has ceased, these tunnels provide a unique means of access to
the glacier bed. In
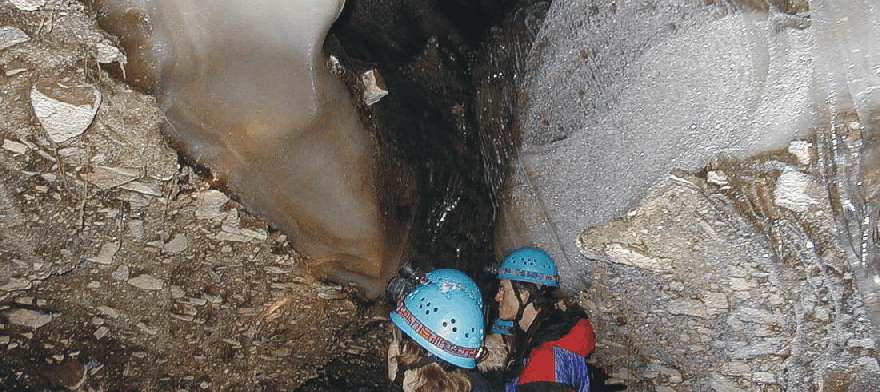
Contact between Longyearbreen glacier and slope sediments below, May 10, 2002.
The exposed glacier bed below Longyearbreen generally takes the appearance of a normal talus or scree slope, with no visual indication of glacial erosion. Inspecting the glacier bed in one of the conduits, about 2 km upstream of the present glacier terminus, a well preserved soil layer with in situ vegetation was found at the glacier-bed interface. The vegetation was undisturbed even though presently 30-40 m active glacier ice covers the site. Trimlines above the modern glacier surface indicate that the ice thickness during the Little Ice Age was 20-30 m greater. The lack of evidence for glacial abrasion on boulders and bedrock exposed at the glacier bed led us to conclude that the glacier has remained cold based at this particular place since it overran the site in the past. This is supported by the visual observation of mosses and other plants extending 1-3 cm up in the basal ice without being deformed by the glacial movement. The temperature at the glacier bed was measured to be about -4oC (March-May 2001, 2002, 2003).
Study
samples were taken from the subglacial soil at several locations 30-35 m below
the modern glacier surface, at 450 m a.s.l. The modern glacier terminus is at
250 m a.s.l., 2 km further downvalley. Macrofossils were investigated in the
laboratory, but only few plant species were found. This corresponds well with
results from similar investigations of macrofossils from other terrestrial
sediments in
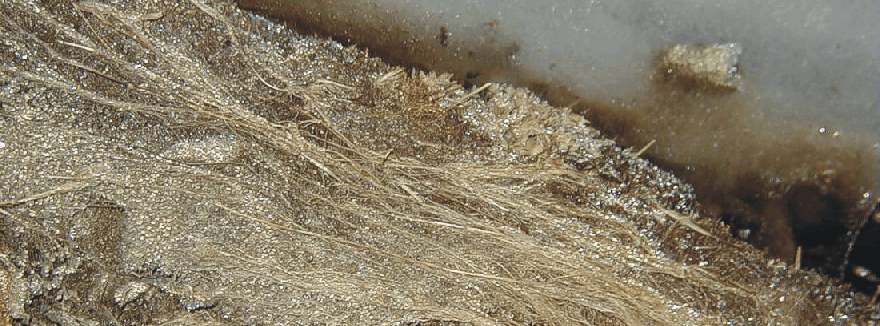
1100 year old vegetation preserved below the glacier Longyearbreen, May 10, 2002. Photo covers about 25 cm across.
Longyearbreen presumably overran the now subglacial soil and vegetation during a winter advance without erosive meltwater activity at the glacier terminus (Humlum et al. 2005). Assuming unchanged prevailing wind conditions, a thick snowdrift probably formed downvalley of the advancing glacier front, just as is the case today along the terminus of Longyearbreen during winter. Such a snow layer may have protected the vegetation to some degree during the glacier advance. It may be speculated that this layer of snow is represented by a white layer of bubbly ice along the glacier-bed interface. Oxygen isotope analysis of ice sampled from this ice layer yielded δ18O values from –11.88 to –12.02, which is only slightly higher than modern winter snowpack values. Modern daily winter air temperatures at the terminus of Longyearbreen typically range from –15 to –30oC.
Frozen samples of soil and vegetation taken from below Longyearbereen were radiocarbon dating (14C). With a probability of 95.4% the period of vegetation growth ended at 1104 cal yr BP. This is a minimum age for the advance of the glacier Longyearbreen over the study site, killing but not destroying the vegetation. Since then the glacier has advanced an additional 2 km downvalley, thereby lowering the altitude of the glacier terminus from about 450 m a.s.l. to 250 m a.s.l. At the time of the advance across the study site the glacier length was about 3 km. The modern length is about 5 km, meaning that the glacier Longyearbreen still is about 2000 m longer than is was about 1100 years ago (Humlum et al. 2005).
The
significant net growth of Longyearbreen since about 1100 years ago apparently is
consistent with a widespread late Holocene (the present interglacial) climatic
development towards cooler conditions in
Click here to download a published scientific paper on the above (pdf; 3.2 MB).
Click here to jump back to the list of contents.
Changing coastal landscapes in Alaska
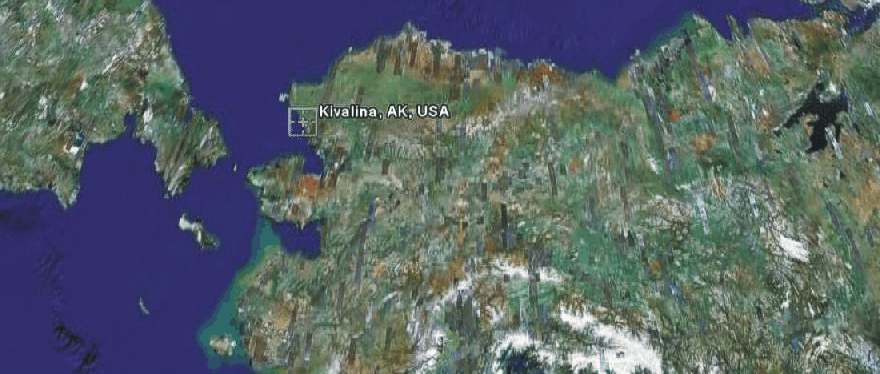
The location of the settlement Kivalina (ca. 68N, 165W) in northwestern Alaska. Kivalina is located on the northeastern shore of the Bering Strait. Easternmost Siberia is seen to the left. The picture measures about 2500 km from left to right. Source: Google Earth.
Inuits living in the
coastal settlement Kivalina in northwestern
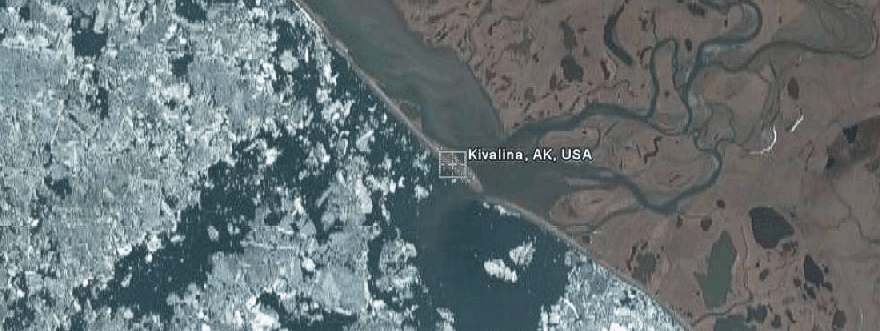
Arial photo of Kivalina, showing the partly ice covered Beiring Strait to the left, and land with rivers and lakes to the right. Kivalina is seen to be located on the coastal barrier island, seperated from the mainland by a laguna. The picture measures about 10 km from left to right. North is up. Source: Google Earth.
From a geomorphological point of view, the setting of Kivalina is interesting. The press release say that Kivalina is located on the tip of a barrier reef. This is not the case. The picture above shows the settlement to be located on a coastal barrier island (or shoal), caused by wave action, and thus demonstrating the occurrence of one or several previous periods with extensive open water conditions in the area, extensive enough to generate big waves. If not so, there would have been no barrier island to establish the settlement on. Thus, the present conditions with relatively little sea ice has most likely occurred one or several times before.
The barrier island on which Kivalina is located must be a relatively new landscape feature, geologically speaking. It is adjusted to the present relative sea level (relative to the land), which in this area probably was reached about 3000-4000 years ago. During this time interval the barrier island have been established by storms during previous open water situations.
Coastal barriers are notorious dynamic landforms, changing form, location and surface relief along with changes in wave activity, wind direction and -strength, and the supply of new sediments (usually sand) by rivers from the hinterland. In periods with high precipitation and high summer river discharge and resulting high sediment transport by rivers, coastal barrier islands tend to aggrade, while the opposite (erosion) dominates in periods with little supply of sediment by nearby rivers. Therefore, not only variations in sea ice, but also a number of other climatic and geomorphological factors control the fate of such delicate coastal features. Usually, coastal barrier islands are considered problematic locations for buildings, roads and other fixed installations. Especially locations near outlets from rivers or lagoons behind are exposed to rapid changes in the coastal outline.
In the Arctic mosquitoes represent a major nuisance, especially in July. Presumably the location for Kivalina was chosen to avoid mosquitoes from the many lakes in the hinterland, and to be close to the open sea during the open water period (summer). The number and outline of the numerous lakes in the hinterland are signalling the existence of permafrost in the area. Barrier islands tend to orient themselves perpendicular to the dominant wind direction during the open water period (summer). In the present case the prevailing summer wind direction apparently is from southwest, helping to keep the mosquitoes at bay in the hinterland, away from Kivalina.
Click here to jump back to the list of contents.
Formation of the Zuiderzee in the Netherlands
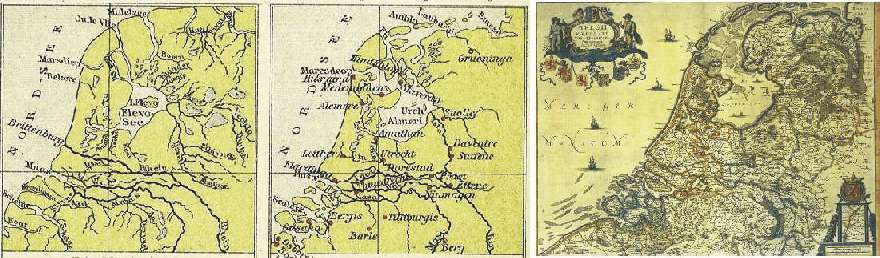
Map showing the outline of the Netherlands with the developing Zuiderzee around year 100 (left) and around year 1000 (centre), according to Tramplers Geographischer Mittelschulatlas, 8th Ed., Wien. The map to the right shows the distribution of land sea 1658 according to Janssonius Map of the Republic of the Seven United Netherlands.
The storm Grote Mandrenke (Great Drowning of Men) strikes the Netherlands in January 1362. Hurricane-force winds with enormous waves and a considerable sea level rise (a storm surge) due to the combined action of push by the wind and lifting of the sea surface because of low air pressure flooded extensive areas of the Netherlands, killing at least 25,000 inhabitants. This number shoulf of cause be seen in relation to the much smaller population at that time than now. The storm also flooded and eroded large land areas in western Slesvig, Denmark, whereby sixty parishes is said to have disappeared totally. Also southern England was severely hit by the storm, with much damage on buildings and infrastructure.
The 1362 storm resulted in severe coastal erosion, contributing to the opening of a pre-existing topographical low in the Netherlands towards the North Sea. This process was already initiated by previous storms, and after a disastrous flood in 14 December 1287 (St. Lucia's flood) the name Zuiderzee came into general usage for this 120 km long pocket-like extension of the North Sea. The 1287 flood is the fifth largest flood in recorded history, and is believed to have drowned somewhere between 50,000 and 80, 000 people.
The North Sea itself is also, in geological terms, a new feature in Europe. Following the termination of the last ice age about 12,500 years ago, the present North Sea was dry land. But due to the general (eustatic) sea level rise which followed until about 5000 years ago because of the melting of the last remnants of the big ice sheets in Europe and North America, and the reduction of the ice sheets in Greenland and Antarctic, global sea level rose and the North Sea was flooded. Before the North Sea expanded to its present size, a shallow topographical depression existed where the Zuiderzee later formed. Of cause this area had poor drainage, and over time became partly filled with peat. During storms like the Grote Mandrenke this peat was easily eroded, and the North Sea extended rapidly inland to form the Zuiderzee.
Around
the Zuiderzee many fishing villages grew up and several of these developed into
fortified towns with important trade connections with other ports in the Baltic
Sea and in England. The village Amsterdam at the southern end of Zuiderzee was
one of these settlements which later developed into a major city. Later this
trade with base in the Zuiderzee developed with connections to most of the world.
The associated economy formed the basis for Netherlands later period of status
and glory, and the trade activities were also foundation for establishing its
colonial empire.
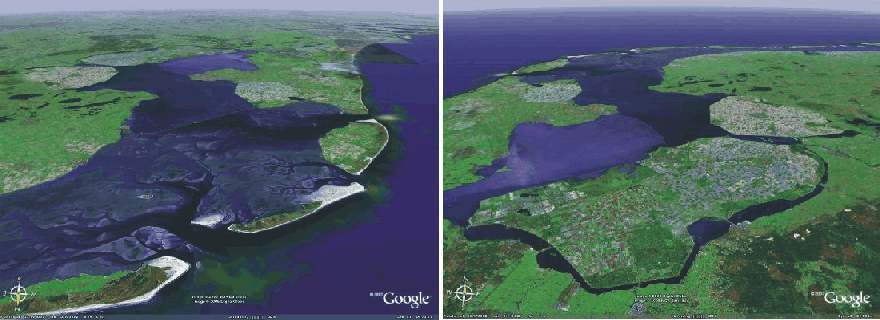
Zuiderzee (IJsselmeer) as seen from north (left), and from the southeast (right). The big dam Afsluitdijk can be seen in the centre of the picture to the left. Between this dike and the open North Sea, a complex systems of tidal channels are seen. The distance from the barrier island coastline in the foreground to the innermost part of IJsselmeer is about 120 km. Reclaimed areas, polders, are seen in the foreground of the picture to the right. The city Amsterdam is located at the southern tip of IJsselmeer (the former Zuiderzee). Source: Google Earth.
It was a severe storm with new floodings in 1916 that prompted the early 20th century construction a large enclosing dam to reclaim parts of the Zuiderzee. The construction of this dam, the Afsluitdijk, for the first time made it possible to control changes of water level in the Zuiderzee during storms. With the completion of the dam in 1932 the Zuiderzee became the inland sea Ijsselmeer, and large water covered areas could be reclaimed for farming and housing by construction of surrounding dikes and pumping. These newly reclaimed areas are today known as polders.
Click here to jump back to the list of contents.