The urban heat island
Open Climate4you homepage
An
urban heat island (UHI) is a metropolitan area which is significantly warmer
than its surroundings. It is well known that urban areas are generally warmer
than nearby rural areas. Often referred to as the urban heat island effect,
urbanization has long been regarded as a potential serious contamination of the
global climate signal (e.g., Landsberg
1956). Even for small settlements in Arctic environments, the temperature
effect has been shown to be considerable (Hinkel
et al. 2003).
The main cause of the urban heat island effect is land surface changes, with roads and buildings taking up an increasing part of the total area, changing the overall reflectance (albedo) of the area. Surfaces covered by roads and buildings reduce evaporation, which is an important surface cooling process, thereby contributing importantly to higher air temperatures within urban areas. Heat generated by energy usage is a second contributor to UHI. As population centres grow they affect larger and larger areas, which usually will experience a corresponding increase in average temperature. Also the local precipitation pattern might be affected by large cities, especially in a downwind direction.
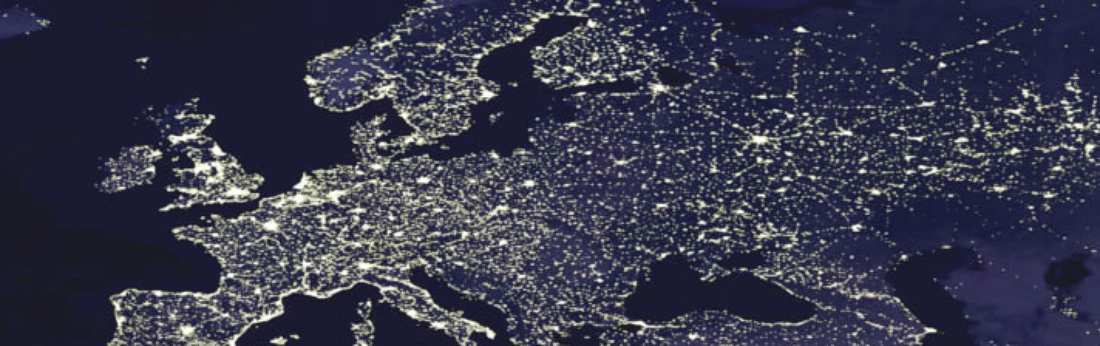
Major
cities in Europe at night, seen from satellite.
The
degree to which UHI affects current estimates of global temperatures remains
under debate. Peterson (2003), based on an analysis of urban and rural
temperatures from 289 stations 1989-1991 in
In conclusion, we still
need to improve our understanding of urban heat islands, the local weather and
climate within cities, and there might be a serious influence of this phenomenon
on current global temperature estimates. The effect would be to make the 20th
century global temperature increase larger than what is real.
The existing network of
meteorological stations was never designed as a means to measure the global
surface temperature. Most of the meteorological stations was established to
obtain information on weather where people are living. And that is precisely
what they are doing. That is also why there is a regrettable lack of
meteorological stations in the
Presumably the urban heat island phenomenon like other natural phenomena is complex, and requires detailed investigations to be fully understood. The effect on global temperature estimates should be carefully evaluated by well-designed measurements in and around urban sites. A more thorough investigation of the urban heat island phenomena probably requires the establishment of several measurement stations spread across the area investigated.
To
exemplify the influence of UHI on surface air temperatures, a series of
temperature traverses was carried out across
Click here to jump back to the list of contents.
| Year | Day | Traverse |
| 2007 | 25 January |   |
| 2007 | 7 June |   |
| 2007 | 10 August |   |
| 2007 | 3 September |   |
| 2008 | 5 September |   |
| 2009 | 3 July |   |
Click on the individual small diagrams to open full-size diagrams.
Click here to jump back to the list of contents.
| Year | Day | Traverse |
| 2007 | 2 February |  |
| 2008 | 20 January |  |
| 2008 | 26 January |  |
| 2008 | 30 January |  |
| 2008 | 31 January |  |
| 2008 | 31 March |  |
| 2008 | 18 April |  |
| 2008 | 28 April |  |
| 2008 | 17 July |  |
| 2008 | 27 July |  |
| 2009 | 24 April |  |
| 2009 | 22 June |  |
| 2010 | 2 May |  |
Click on the individual small diagrams to open full-size diagrams.
Click here to jump back to the list of contents.
| Year | Day | Traverse |
| 2007 | 13 December |  |
| 2008 | 11 January |  |
| 2008 | 25 February |  |
| 2008 | 6 May |  |
| 2008 | 11 June |  |
Click on the individual small diagrams to open full-size diagrams.
Click here to jump back to the list of contents.
Other local meteorological phenomena
| Year | Day | Phenomena |
| 2008 | 1 August | Effects of Svalbard solar eclipse |
| 2008 | 2 September | Recent Svalbard warming revisited |
Click on the individual small diagrams to open full-size diagrams.
Click here to jump back to the list of contents.